Wallboard - Linistry integration - content creation
Geomant does not support this feature at this time. For more information, please contact us at supportdesk@geomant.com
This document will walk you through the steps of how you can create a content that can display your Linistry integrated datasources.
The datasources which we connected in the Linistry integration - connector setup guide will have a data structure like this:
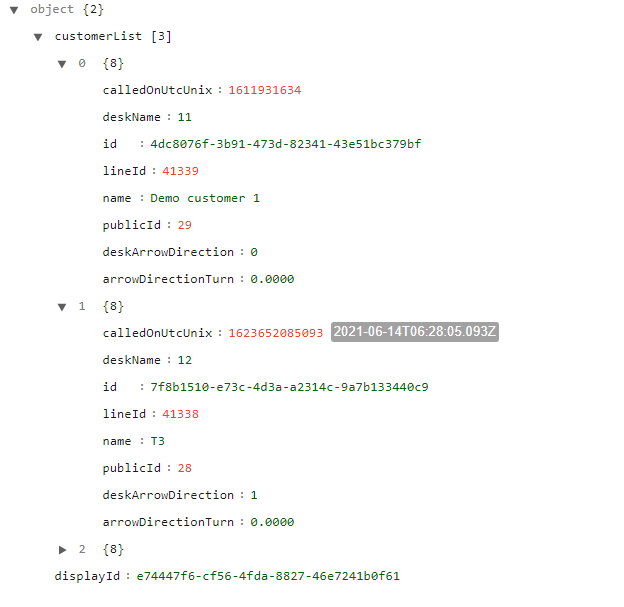
Each datasource represents one Linistry display and contains its display ID and the associated customer list for that specific display.
In the customer list array, each item represents a single called customer.
- calledOnUtcUnix: Unix timestamp of the time when the customer was called
- deskName: Name of the desk that the customer is called to
- id: Called customer item identifier
- lineId: Identifier of the line
- name: Name of the customer that is called
- publicId: The queue order number for the called custom
- deskArrowDirection: Arrow direction number from 0 to 7, where 0 represents east and goes around clockwise with 45-degree increments
Content creation
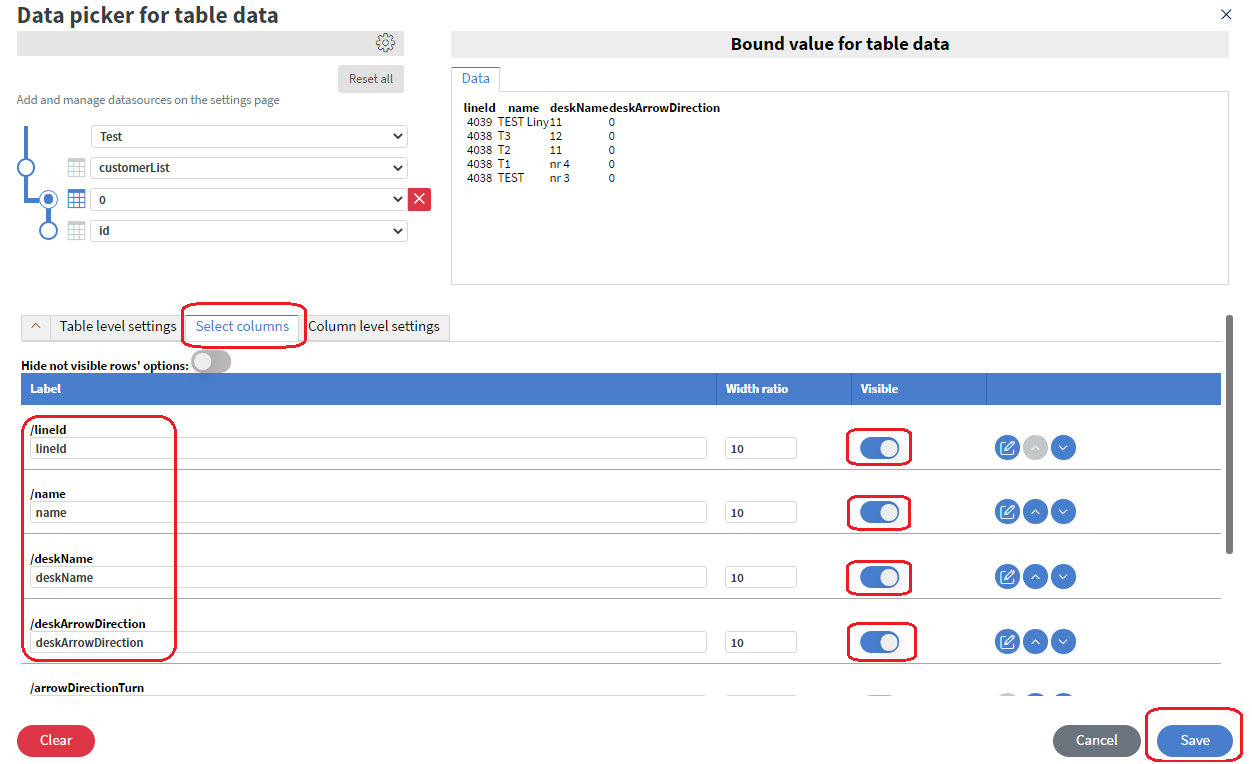
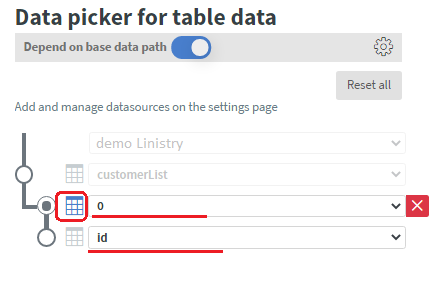
The easiest way to display this data is to use a table element, and connect the datasource to it. Connect your datasource as shown on the example below, and select the columns you want to show on the selected columns tab.
A more complex content setup would use dynamic page generation to display each customer item from the list.
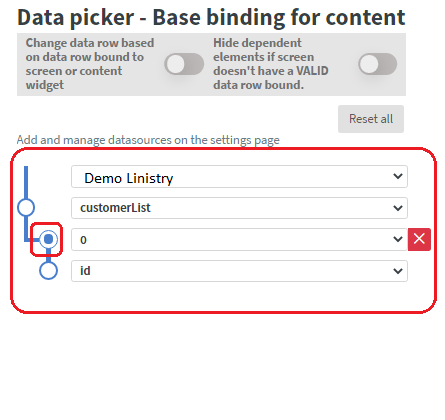
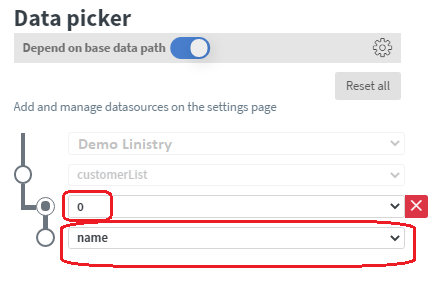
For that you will need to connect the base data path of your content to your datasource.
Make sure you place the iteration dot to the array level of your datasource as shown in the example below.
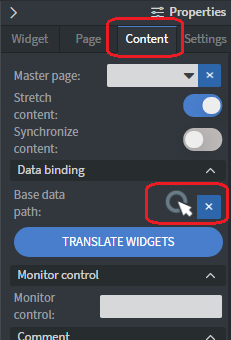
Open the base datapath setup modal on the content settings tab.
Create a new page that will be the one generated for each customer item of the list.
Place your elements on the page and connect them to the first item of the base datapath, which you can do with the Bind to data option of the widget.
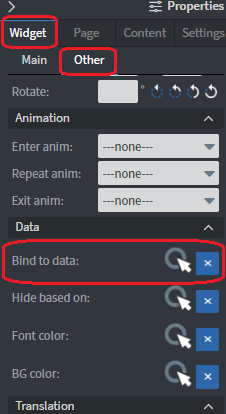
Connect each element to the data point that represents the information you want to display with that element.
You can also use this method to display the arrow directions.
Connect the deskArrowDirection property of the customer Item to an image element.
The element will look for a file named like the connected data point's value, so upload images called 0,1,2,3...7 for each arrow direction.
Once your single customer item page is set up, we can do the generation with a table element on the main page of your content.
Connect your datasource to the table element just like in the first example.
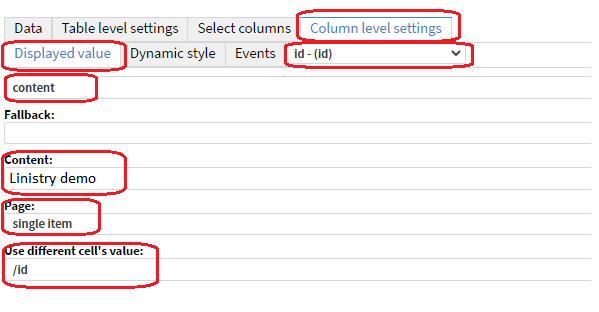
On the selected columns tab select only the ID row and click the edit button at the end of the row.

Set the type of the row to Content and select this content as the source and set the page to the single customer item page we create previously.
You can play around with the table elements size to fit the generated smaller contents.
You can also populate the rest of the content with advertisements and regular signage content.