How to implement chart.js custom widget into Wallboard
Please keep in mind that this widget is still under development.
Before you read this make sure you have already read these articles.
You can download the sample file here.
After upload, you can start using it in our editor.
You can set several options to your chart:
- Title: Your chart’s title
- Opacity: The quality of lacking transparency or translucence.
- Chart type: Line, Bar, Radar, Pie
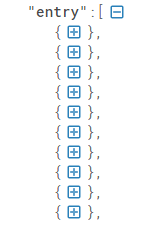
- Dataset: Your used data. You don’t need to set all the deeps and levels for it. It is enough to set the first one where all the data is shown. (We have to note, that we use JSON arrays for the data.
Data structure:
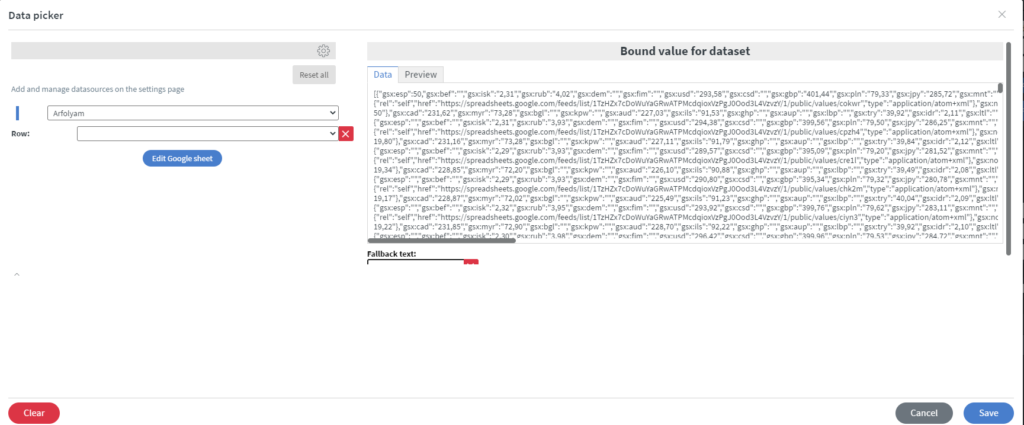
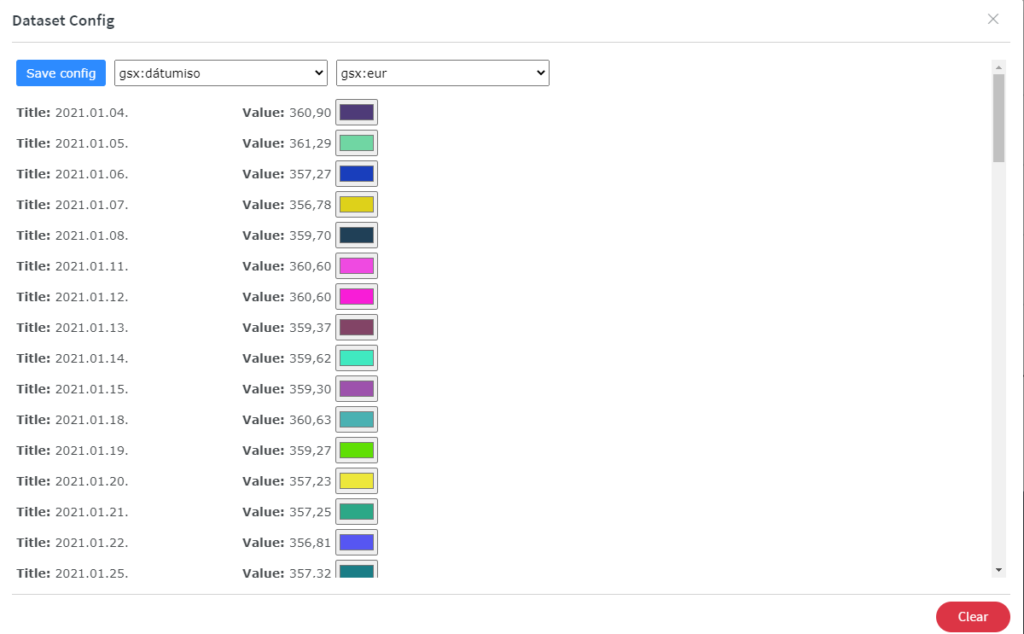
With the  button, you can configure your data.
Style settings:
- Custom colors: All data get a random color. (Default: false)
- Border color: Set a color for the border.
- Background color: Set the background color for the chart
- Border width: Set a width for the borders.
- Labels rotation: Rotation for tick labels.
- Font size: Default font size (in px) for text.
Option settings:
- Legend position: Position of the legend.
- Show legend: Is the legend shown?
- Span gaps: If true, lines will be drawn between points with no or null data. If false, points with null data will create a break in the line.
- Display X labels: If true, display the X labels
- Display Y labels: If true, display the Y labels
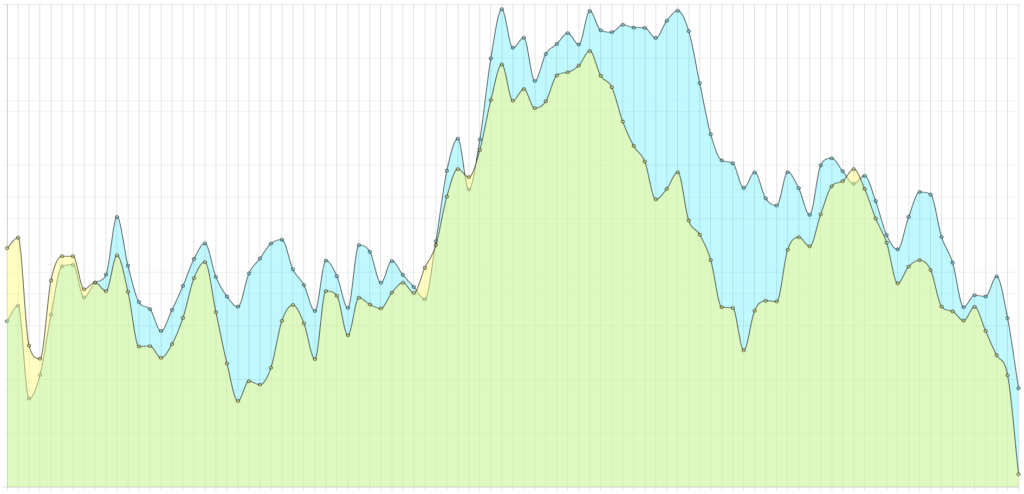
With the background color transparency you can set more charts in one content like here:
If you want to modify the source code here is the folder structure for it:
custom-widget-chart-line/
├─ public/
│ ├─widget/
│ │ ├─style.css // Edit this if you want to change the chart area.
│ │ ├─script.js // Edit this if you want to change the logic of the chart.
│ │ ├─index.html // Edit this if you want to change the chart container HTML.
│ │
│ ├─config/
│ │ │ ├─dataset_config/
│ │ │ │ ├─script.js // Edit this if you want to change the logic of the dataset-config.
│ │ │ │ ├─reset.css // Do not edit this.
│ │ │ │ ├─dataset-config.html // Edit this if you want to change the dataset-config button HTML.
│ │ │ │ ├─dataset-config.css // Edit this if you want to change the dataset-config button CSS.
│ │ │ ├─dataset_config_2/
│ │ │ │ ├─script.js // Edit this if you want to change the logic of the dataset-config2.
│ │ │ │ ├─reset.css // Do not edit this.
│ │ │ │ ├─dataset-config2.html // Edit this if you want to change the dataset-config2 button HTML.
│ │ │ │ ├─dataset-config2.css // Edit this if you want to change the dataset-config2 button CSS.