Power BI Report pages for Buzzeasy CC for MS Teams
This documentation relates to version 19 of the Buzzeasy Power BI performance reports.
Microsoft Power BI is used to prepare these reports. You need a Power BI Pro license to view these shared reports.
Source tables for these reports are detailed in the odata stream definition page here.
Find each of the reports listed below, along with screenshots and descriptions of the data shown. The abbreviation KPI refers to key performance indicators throughout.
Historical reporting aims to show data from the previous 24 hour period, to the time period governed by the data retention policy. You may filter the data in the reports by date and by other categories of data. You can use the filter to control the time-frame of the historical data shown.
All current day data is available in the real-time wallboard view and in the supervisor dashboard.
Filtering Panel

Find the filtering panel on every report page, under the report page's title.
The filter panel holds the filters available for filtering the data seen in the report. The filters are synchronized between the report pages. This means that when you set a filter on one report page, the other report pages are also filtered.
Hold CTRL on the keyboard, to select several values in the filters.
Service Level Definition
The Service Level metric is found in many of the reports.
Please keep in mind that the Service level may be calculated in many ways. It can change subject to business requirements.
This is the current formula for calculating the Service Level.

Customer Satisfaction Report page
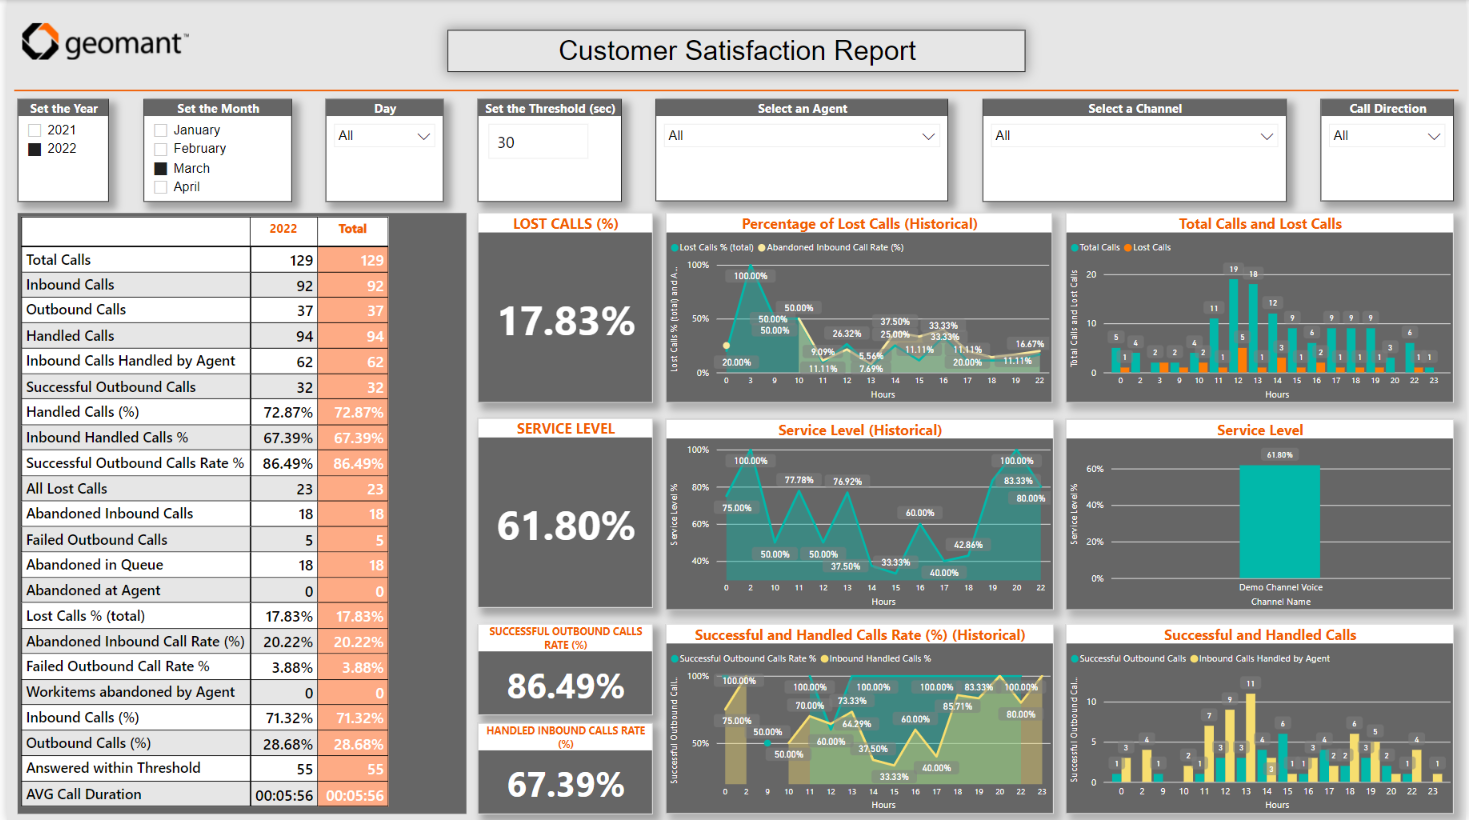
Customer Satisfaction Report - Table of KPIs
|
|
| Total Calls |
Total calls, including successful and unsuccessful calls, in both call directions. |
| Inbound Calls |
Total inbound calls. |
| Outbound Calls |
Total outbound calls. |
| Handled Calls |
Total calls handled, in both call directions. |
| Inbound Calls Handled by Agent |
Total inbound calls handled. |
| Successful Outbound Calls |
Total outbound calls handled (reached customer). |
| Handled Calls (%) |
Handled calls as a percentage of the Total calls. |
| Inbound Handled Calls (%) |
Inbound calls handled, as a percentage of all inbound calls. |
| Successful Outbound Calls (%) |
Successfully handled outbound calls as a percentage of all outbound calls. |
| All Lost Calls |
Total lost calls, including all abandoned calls and failed outbound calls. |
| Abandoned Inbound Calls |
Total of abandoned inbound calls. |
| Failed Outbound Calls |
Total failed outbound calls (the customer was not reached). |
| Abandoned in Queue |
Total calls abandoned by customers while waiting to be connected with an agent. |
| Abandoned at Agent |
Total abandoned workitems. |
| Lost Calls (%) total |
Total lost calls as a percentage of the total calls. |
| Abandoned Inbound Call Rate (%) |
Abandoned calls as a percentage of total inbound calls. |
| Failed Outbound Call Rate (%) |
Total failed outbound calls as a percentage of total outbound calls. |
| Workitems abandoned by Agents |
Total workitems agents abandoned. |
| Inbound Calls (%) |
Total inbound calls as a percentage of the total calls. |
| Outbound Calls (%) |
Total outbound calls as a percentage of the total calls. |
| Answered within Threshold |
Total calls answered within the threshold set in the filtering panel. |
| AVG Call Duration |
Average call duration. Includes the answering duration, and the connected duration. |
Lost Calls (%) vertically aligned visuals
Below the table of key performance indicators are the Lost Calls % visualizations. The lost call percentage is the total lost calls as a percentage of the total calls.
|
|
| Lost Calls (%) card |
Calls with abandoned or failed call result, as a percentage of the total number of calls. |
| Percentage of Lost Calls (Historical) |
An area chart displaying total lost calls (%) plus total abandoned inbound calls (%) data, split by months. Drill down to day name, day of month, month or to start hours. |
| Total Calls and Lost calls per hour |
Stacked column chart showing total calls and total lost calls by hour. This may be split by channels, day of month, hours. |
Service Level
|
|
| Service Level (%) card |
Answered calls (within threshold) as a percentage of total inbound calls. |
| Service Level (Historical) |
An area chart displaying service level (%) data split by months. This may be drilled down to day name, day of month, month or to start hours. |
| Service Level per hours |
A clustered column chart of the service level by hours. This may be split by channels, day of month, hours. |
Find the service level definition here.
Successful Outbound calls rate (%) and Handled Inbound calls rate (%)
|
|
| Successful Outbound Calls Rate (%) |
Successful calls (reached customer) as a percentage of the total number of outbound calls. |
| Handled Inbound Calls Rate (%) |
Handled calls as a percentage of the total inbound calls. |
| Successful and Handled Calls Rate (%) (Historical) |
Successful and Handled Calls on an area chart split by months. Drill down to day name, day of month, month or to start hours. |
| Successful and Handled Calls |
A clustered column chart. Number of Successful outbound calls and Handled inbound calls. May be split by channels, day of month, hours. |
Operational Efficiency Report page
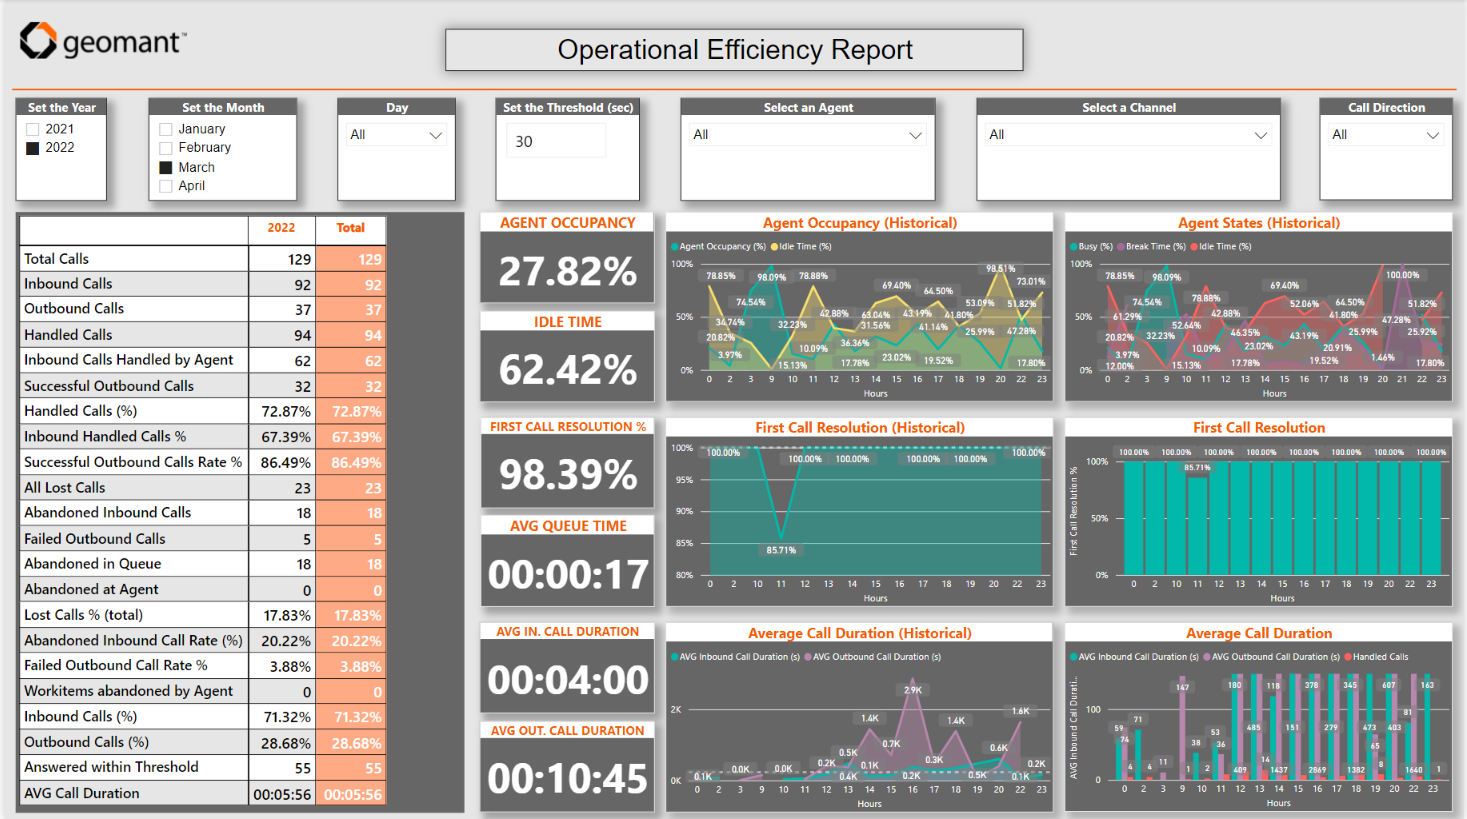
Operational Efficiency Report - Table of KPIs
|
|
| Total Calls |
Total number of calls including, successful and unsuccessful calls, in both directions. |
| Inbound Calls |
Total of inbound calls. |
| Outbound Calls |
Total of outbound calls. |
| Handled Calls |
Total handled calls in both call directions. |
| Inbound Calls Handled by Agent |
Total inbound calls handled. |
| Successful Outbound Calls |
Total outbound handled calls (reached customer). |
| Handled Calls (%) |
Handled calls as a percentage of total calls. |
| Inbound Handled Calls (%) |
Handled calls as a percentage of inbound calls. |
| Successful Outbound Calls (%) |
Handled outbound calls as a percentage of outbound calls. |
| All Lost Calls |
Lost calls, includes all abandoned calls and failed outbound calls. |
| Abandoned Inbound Calls |
Total of abandoned inbound calls. |
| Abandoned in Queue |
Total calls abandoned by customers while waiting to be connected with an agent. |
| Abandoned at Agent |
Total abandoned workitems. |
| Lost Calls (%) total |
Lost calls as a percentage of Total calls. |
| Abandoned Inbound Call Rate (%) |
Abandoned calls as a percentage of inbound calls number. |
| Failed Outbound Call Rate (%) |
Failed outbound calls as a percentage of outbound calls number. |
| Workitems abandoned by Agents |
Total workitems abandoned by agents. |
| Inbound Calls (%) |
Inbound calls as a percentage of the total calls number. |
| Outbound Calls (%) |
Outbound calls as a percentage of Total calls. |
| Answered within Threshold |
Calls answered within the threshold set in the filtering panel. |
| Failed Outbound Calls |
Total of failed (customer not reached) outbound calls. |
| AVG Call Duration |
Average call duration, answering duration plus connected duration. |
Agent Occupancy
|
|
| Agent Occupancy card |
The agents active time duration as a percentage of agents login duration. Active time duration contains the Busy and Supervisor Mode Break durations. |
| Idle Time |
Agents Idle time as a percentage of Login duration. |
| Agent Occupancy (Historical) |
An area chart displaying Agent Occupancy and Idle time. Drill down to day name, day of month, month or to start hours. |
| Agent States (Historical) |
An area chart displaying Busy, Break and Idle durations as a percentage of login duration, split by months. Drill down to Days of Week or to Start Hours. |
First Call Resolution
|
|
| First Call Resolution card |
Percentage of calls handled by the first agent. |
| First Call Resolution (Historical) |
An area chart with the Call Transfer rate (%) split by Months. Drill down to Days of Week. |
| First Call Resolution per Channels |
A clustered column chart showing the Call Transfer rate split by channels. Drill down to Start Hours. |
AVG Queue Time
|
|
| Average Queue Time card |
The average waiting time of customers in the queue. |
Average Call Duration
|
|
| AVG Inbound Call Duration card |
The average inbound call duration. Hours Minutes Seconds format. |
| AVG Outbound Call Duration card |
The average outbound call duration. Hours Minutes Seconds format. |
| Average Call Duration (Historical) |
An area chart displaying the average call duration. Seconds format. Drill down to day name, day of month, month or to start hours. |
| Average Call Duration per Channels |
A clustered column chart displaying Average inbound call duration, Average number outbound calls and the Number of handled calls. May be split by channels, day of month or hours. |
Agent Performance Report page
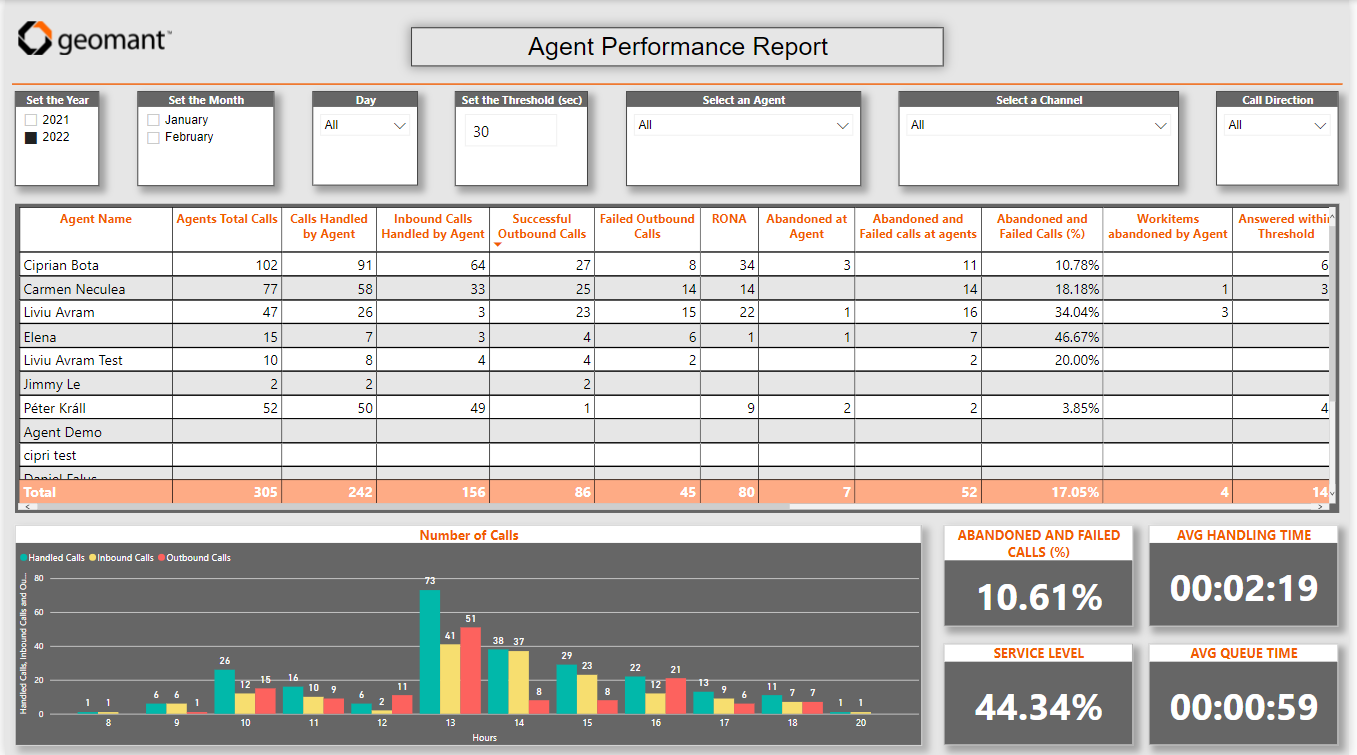
The Agent Report presents information about agent performance. The performance information is displayed in the table under the filtering menu.
Below the agent performance information table find additional information specific to agents selected in the filters.
|
|
| Agent Name |
List of the Agents working in the Call Center. |
| Agent Total Calls |
Total calls. This includes successful and unsuccessful calls, in both directions. |
| Calls handled by Agent |
Total of inbound calls and successful outbound calls handled. |
| Inbound Calls Handled by Agent |
Total inbound calls handled by agent with a call result. |
| Successful Outbound Calls |
Total outbound calls with a successful call result. |
| Failed Outbound Calls |
Total outbound calls with a failed call result. |
| RONA |
Total number of times the operator alert limit was reached, redirecting the customer to the queue. Caused by the agent not answering a call within the RONA threshold time. |
| Abandoned at Agent |
Total calls abandoned by the customer, before the agent answered the call. |
| Abandoned and Failed calls at agents |
The sum of failed outbound and abandoned at agent calls. |
| Abandoned and Failed Calls (%) |
Number of failed outbound calls plus total abandoned at agent calls, as a percentage of agent’s total calls. |
| Outbound Workitems abandoned by Agent |
Outbound conversations abandoned by agents |
| Answered within Threshold |
Total answered inbound calls that were answered within the threshold that is set in the filtering menu. |
| Answered within Threshold (%) |
The percentage of answered inbound calls that were answered within the threshold that is set in the filtering menu. |
| AVG Inbound Connected Time |
The average connected time of inbound calls. |
| Wrap-up Time |
Time spent on call in after-work. |
| AVG Wrap-up Time |
Average time spent on call in after-work . |
| Login Duration |
The sum of Busy, Idle and Break agent state durations. |
| Break Duration |
The sum of Break agent state durations. |
| Idle Duration |
The sum of the Idle agent state duration. |
| Active Duration |
The Agents active time during the login duration. Combined Busy and Supervisor Mode agent state durations. |
| Supervisor Mode |
Duration of time Supervisors spent in Supervisor Mode. |
Number of Calls visual
|
|
| Number of Calls |
A clustered column chart. Displays the Number of Handled calls, Inbound calls and Outbound calls, split by Channels. This may be further split by agent names, month, day of month, and hours. |
Abandoned and Failed Calls (%)
|
|
| Abandoned and Failed Calls (%) |
Sum of Failed outbound calls and Abandoned at agent calls, as a percentage of Agent’s total calls. |
AVG Handling Time card
|
|
| AVG Handling Time card |
Displays average of call handling time (connected time). |
Service Level Card
|
|
| Service Level card |
Answered calls (within threshold) as a percentage of total inbound calls. |
Find the service level definition here.
AVG Queue Time Card
|
|
| Average Queue Time |
Displays the average waiting time of customers in the queue. |
Detailed Agent States Report page
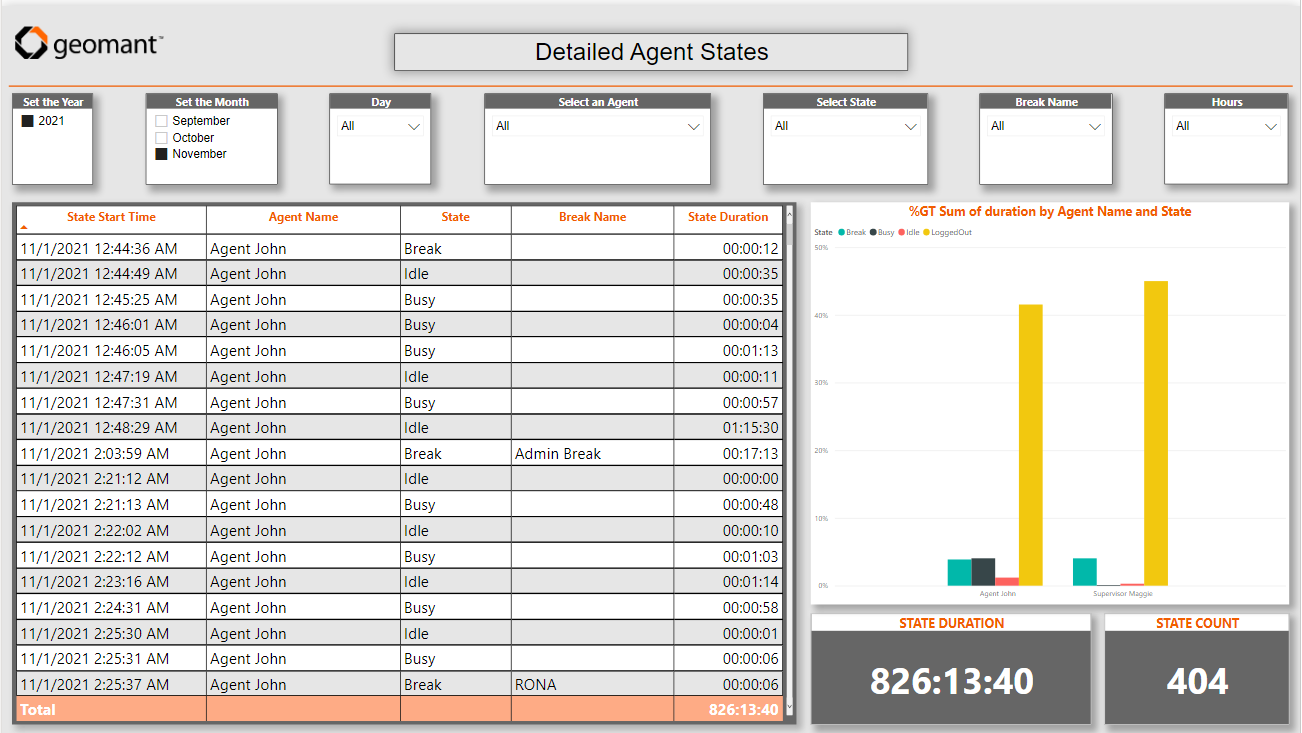
The Detailed Agent States report page displays information about agent states. Agents states display on the left side of the page, in the table under the filtering menu. On the right of the table additional information appears showing agent state specific information.
Detailed Agent State table
|
|
| State Start Time |
The datetime stamp of the state. |
| Agent Name |
List of agents working in the Call Center. |
| State |
The agent state. |
| Break Name |
The break state name. |
| State Duration |
Duration of time agent is in this state. |
%GT Sum of duration by Agent Name and State visual
|
|
| %GT (Grand Total) Sum of duration by Agent Name and State visual |
A clustered column chart. Graphically displays the Sum of all individual state durations as a percentage of the total of all states' duration. |
State Duration card
|
|
| State Duration |
The duration of the state. |
State Count card
|
|
| State Count card |
Total states. |
Detailed Call Report page
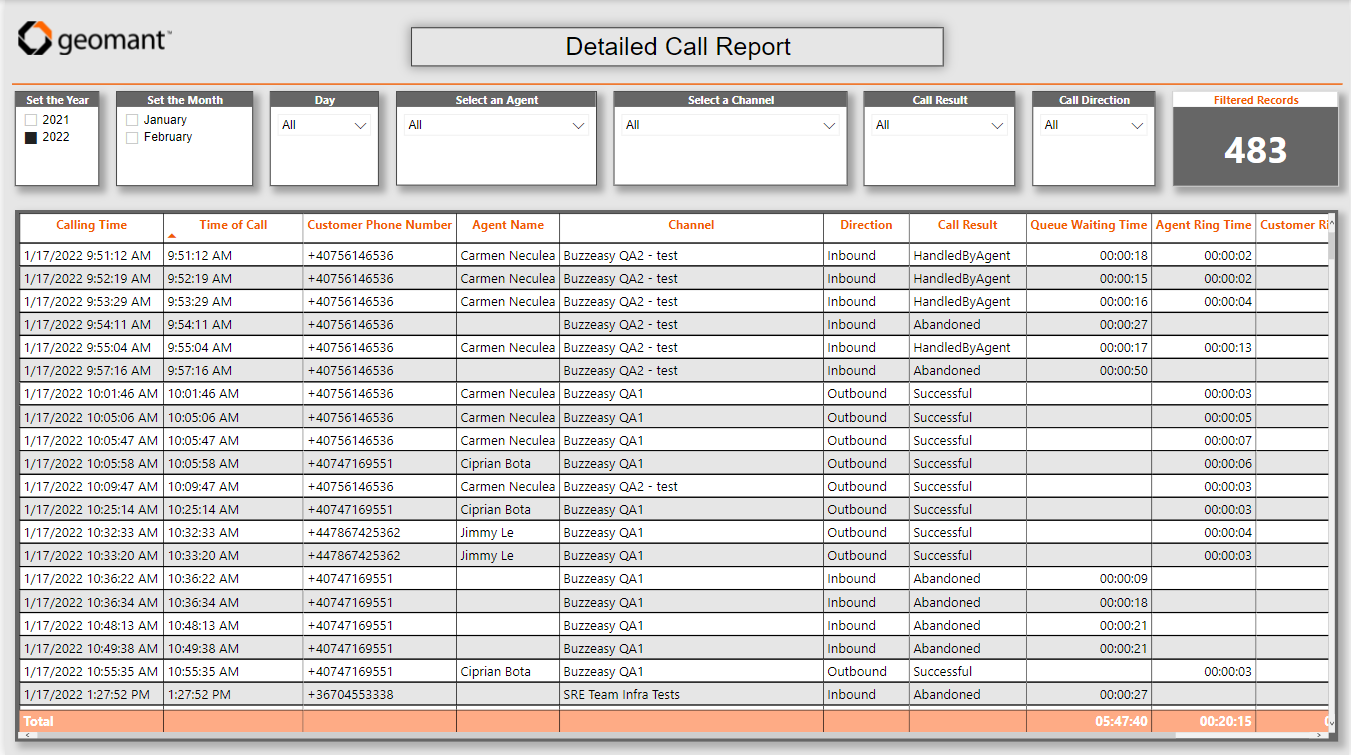
The detailed call report page displays detailed information about every call made within Buzzeasy.
Detailed Call Report table
|
|
| Calling Time |
The datetime stamp of the call. |
| Time of Call |
The timestamp of the call. |
| Customer Phone Number |
The phone number of the customer. |
| Agent Name |
The name of the Call Center agent handling the call. If empty, the call was abandoned before it reached an agent. |
| Channel |
The channel names the call arrived at. |
| Direction |
The direction of the call. |
| Call Result |
The result of the call. In the case of an inbound call: Handled by agent, or Abandoned. In the case of an outbound call: Successful, or Failed. |
| Queue Waiting Time |
The time the customer spent in the queue waiting or the call to be answered. |
| Agent Ring Time |
The time the call was ringing at an agent. |
| Customer Ring Time |
The time the call was ringing at the customers side of the call (outbound calls). |
| Connected Time |
The time the Customer was connected with an Agent. |
Call Averages Report page
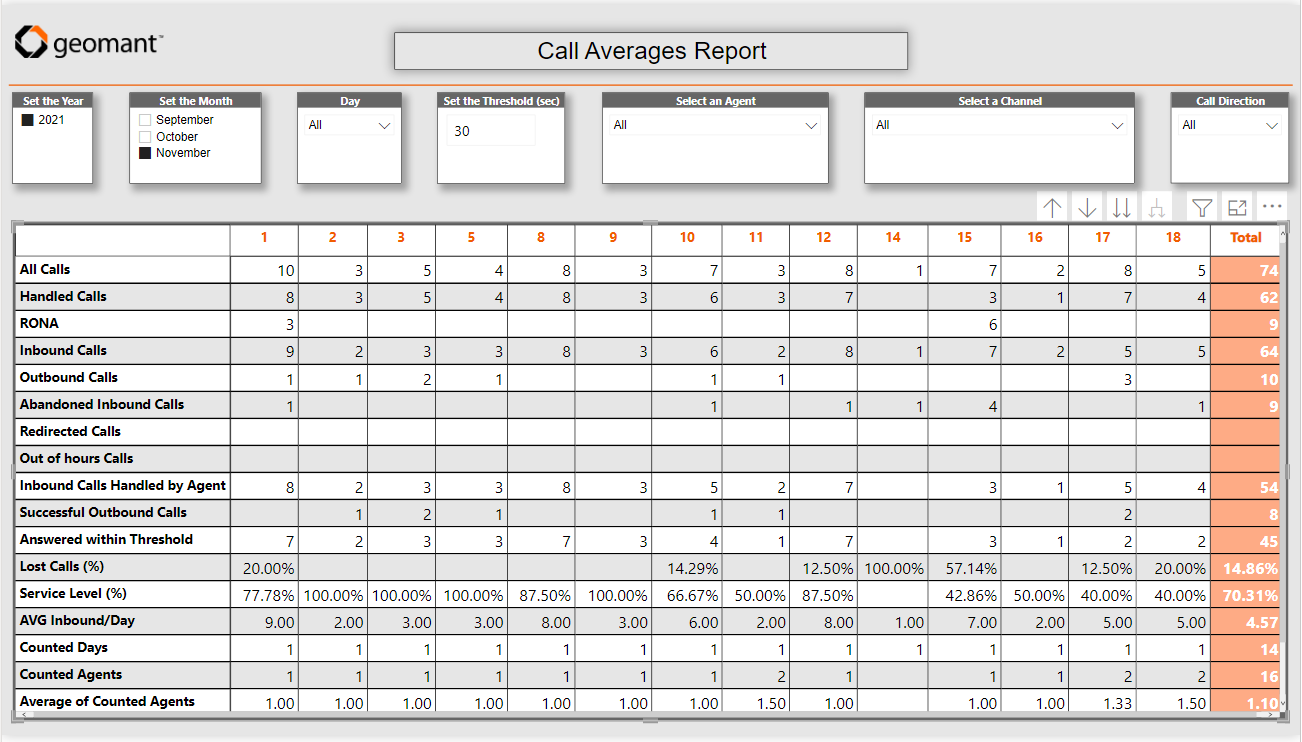
The Call averages report page displays a table with the call center's key information split by months.
Call Averages Report - Table of KPIs
|
|
| All Calls |
Total number of calls, including successful and unsuccessful calls in both call directions. |
| Handled Calls |
Total handled calls in both call directions. |
| RONA |
Total calls returned to the queue by RONA feature. Caused by the agent failing to answer within the RONA threshold duration. |
| Inbound Calls |
Total inbound calls. |
| Outbound Calls |
Total outbound calls. |
| Abandoned Inbound Calls |
Total of abandoned inbound calls. |
| Redirected Calls |
Total calls redirected in the workflow. |
| Out of Hours Calls |
Total calls made outside of the business hours set in the Buzzeasy portal. |
| Inbound Calls Handled by Agent |
Total handled calls in the inbound call direction. |
| Successful Outbound Calls |
Total handled calls (reached customer) in the outbound call direction. |
| Answered within Threshold |
Total calls answered within the threshold set in the filtering panel. |
| Lost Calls % |
Total lost calls as a percentage of Total calls. |
| Service Level % |
Answered calls (within threshold) as a percentage of total inbound calls. |
| AVG Inbound / Day |
The average number of inbound calls per day. |
| Counted Days |
Total number of days. |
| Counted Agents |
Total number of agents working in the selected date period. |
| Average of Counted Agents |
Average number of agents working in the selected date period. |
| AVG Inbound Connected Time |
Average connected time for inbound calls. |
| AVG Outbound Connected Time |
Average connected time for outbound calls. |
Find the service level definition here.
Missed Calls Report page
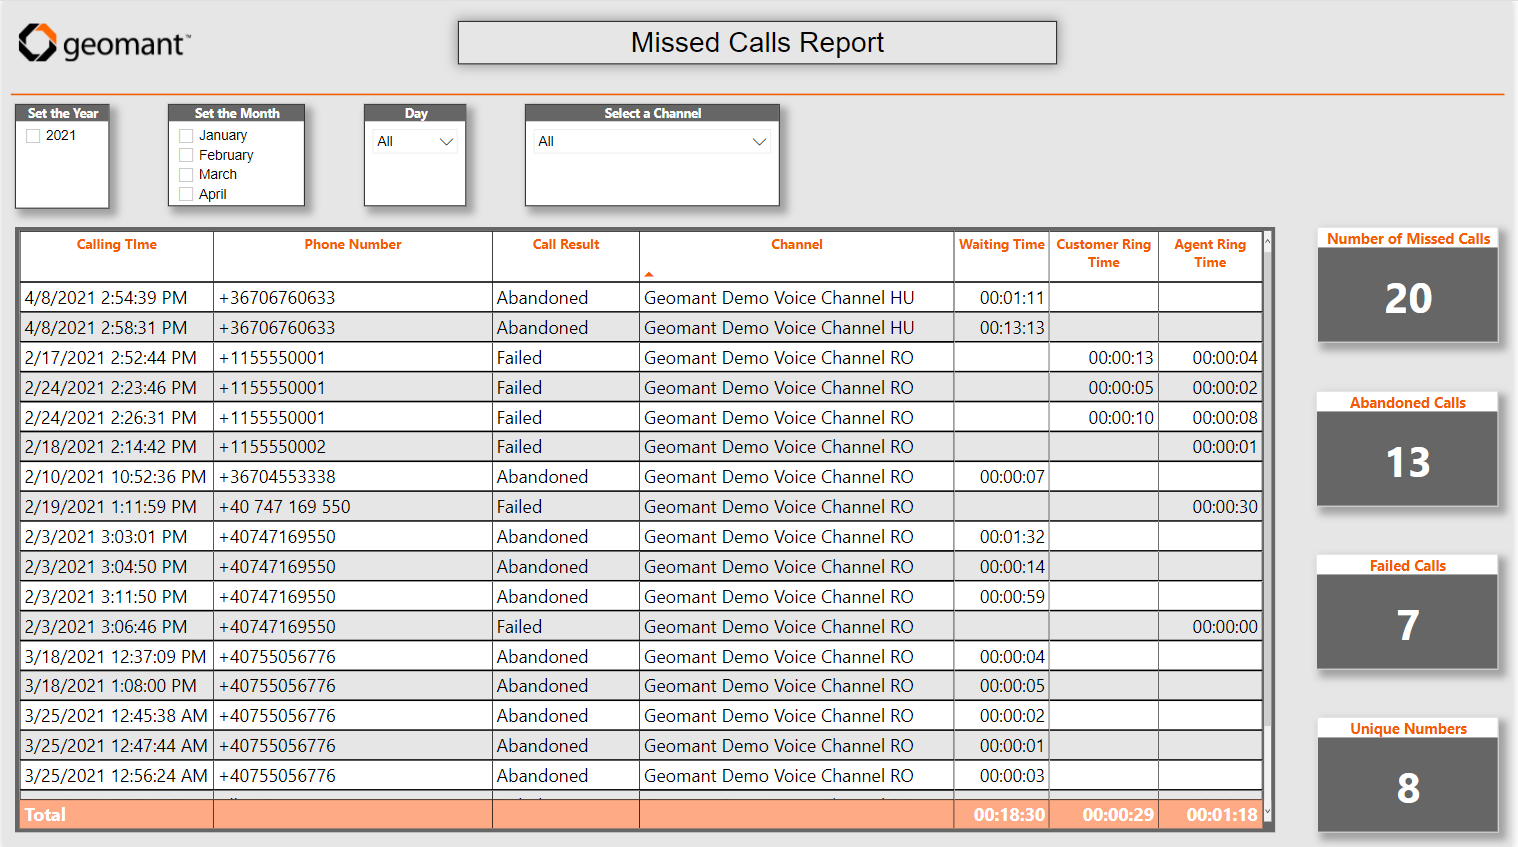
Missed Calls report page contains a table with all the abandoned inbound and failed outbound calls for the given day. Once the customer was reached the record will disappear from the list once the report is refreshed.
Missed Calls table
|
|
| Calling Time |
Time of the call. |
| Phone Number |
The phone number of the customer. |
| Call Result |
Result of the call. In the case of an inbound call - Abandoned. In the case of an outbound call - Failed. |
| Channel |
The channel name the call has arrived at. |
| Waiting Time |
The time the customer spent in the queue waiting for their call to be answered. |
| Customer Ring Time |
The time the call was ringing on the customers side of the call, in the case of an outbound call. |
| Agent Ring Time |
The time the call was ringing at the agent. |
Number of Missed Calls
|
|
| Number of Missed Calls card |
Displays the sum of the unsuccessful or unanswered calls. |
Abandoned Calls
|
|
| Abandoned Calls card |
Displays the total of inbound abandoned calls. |
Failed Calls
|
|
| Failed Calls card |
Displays the total of outbound failed calls. |
Unique Numbers
|
|
| Unique Numbers card |
Displays the total of unique phone numbers. |
Call Statistics by Hours Report page
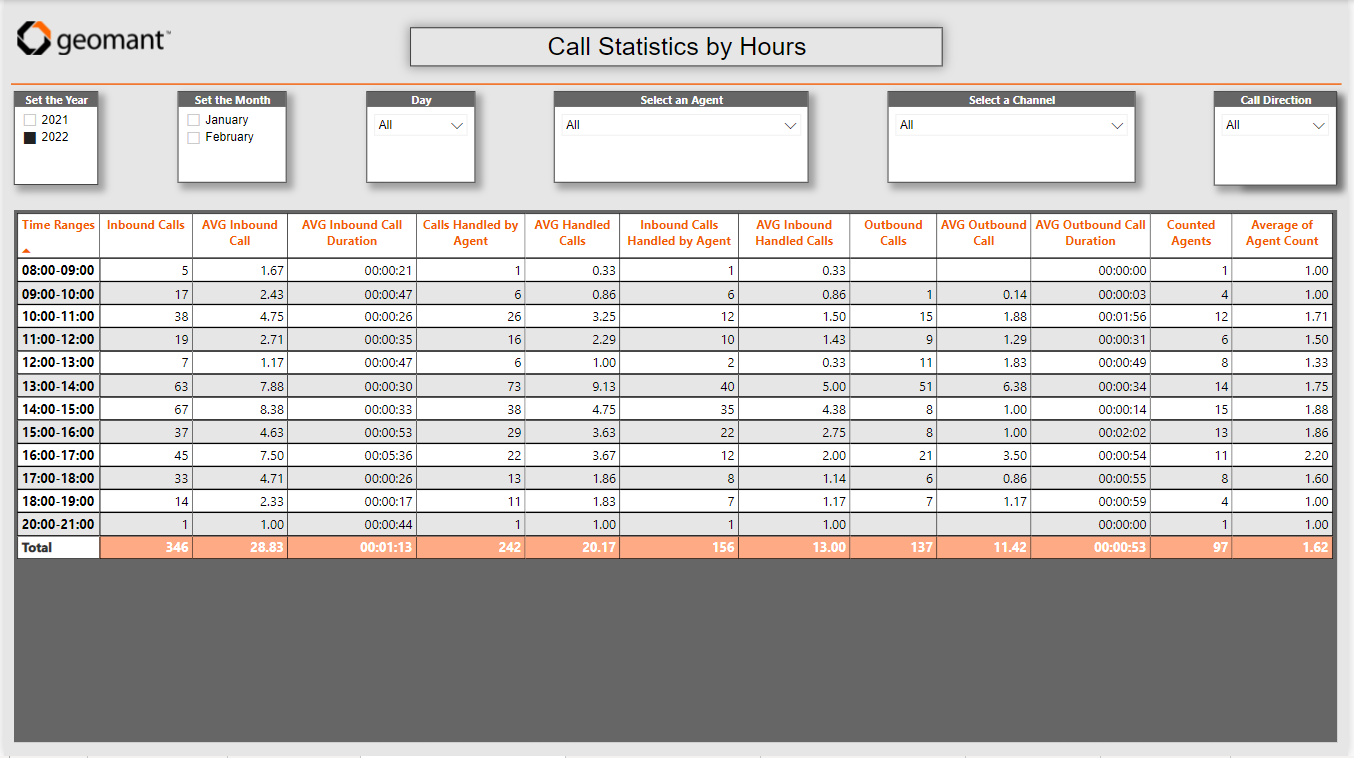
The call statistics by hours report displays a table of call center performance data, split by working hours.
Call Statistics by Hours table
|
|
| Time Range |
Hour ranges the data is split by. |
| Inbound Calls |
Total of inbound calls. |
| AVG Inbound Calls |
Average number of inbound calls. |
| AVG Inbound Call Duration |
Average duration of the inbound calls. |
| Calls Handled by Agent |
Total of inbound calls handled plus total successful outbound calls. |
| AVG Handled Calls |
Average number of handled calls. |
| Inbound Calls Handled by Agent |
Total inbound calls handled. |
| AVG Inbound Handled Calls |
Average number of inbound handled calls. |
| Outbound Calls |
Total of outbound calls. |
| AVG Outbound Calls |
The average number of outbound calls. |
| AVG Outbound Call Duration |
The average duration of the outbound calls. |
| Counted Agents |
Total working agents. |
| Average of Agent Count |
Average number of working agents |
Closure Codes Report page
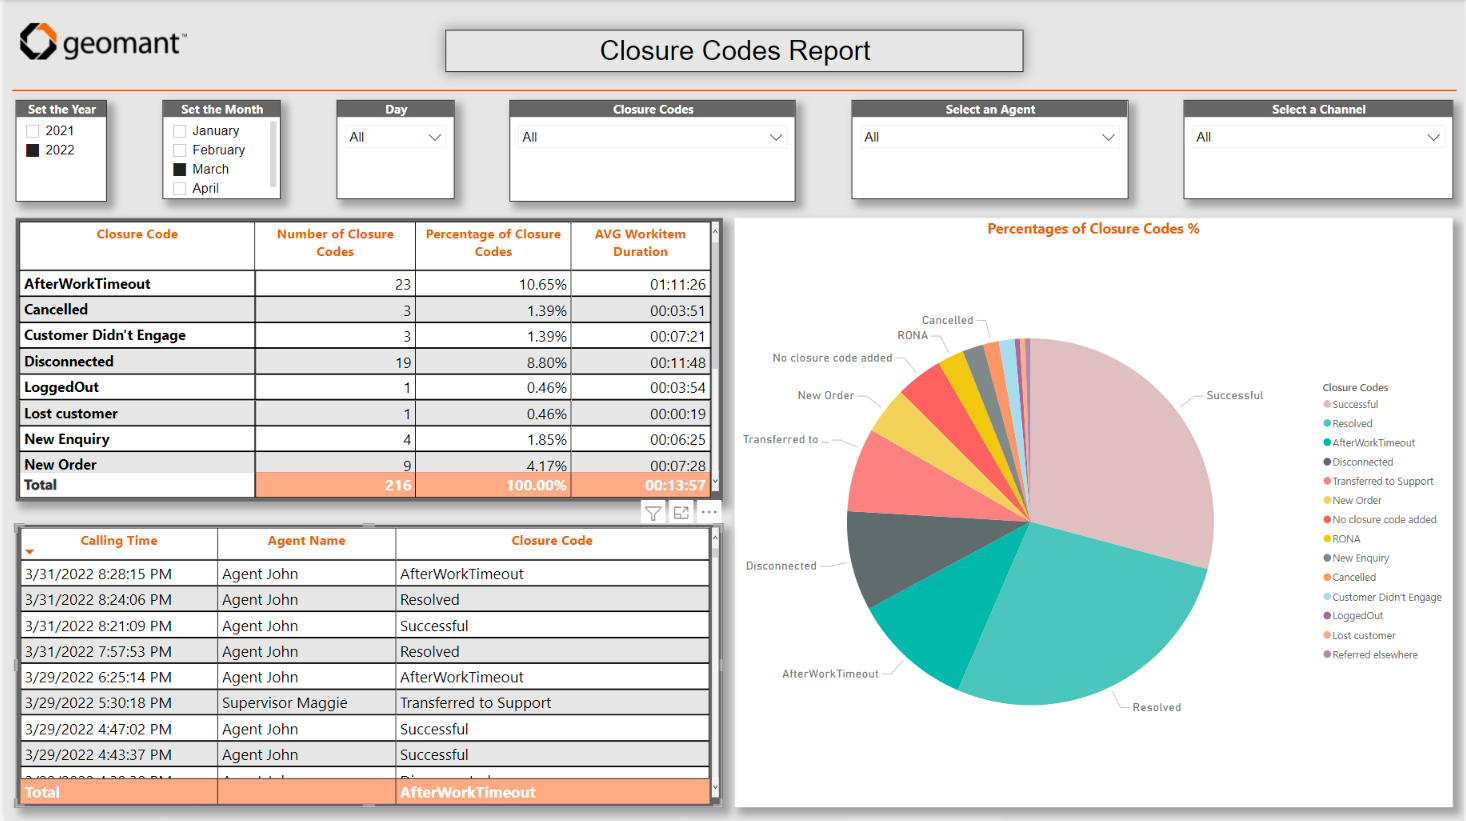
The closure codes report page consists of a table and a pie chart.
The closure codes report page displays information about the closure codes offered to Agents. These include automatic closure codes generated by Buzzeasy and the closure codes Agents may select manually, at the end of the conversation as a part of the wrap-up process.
Table of Closure codes
|
|
| Closure Code column |
Displays all the closure codes of the workitems processed. |
| Number of Closure Codes column |
Total closure codes. |
| Percentage of Closure Codes |
The percentage of closure codes out of the total number of closure codes. |
| AVG Duration |
The average duration of the workitem, including the preview time, active time and wrap-up time. |
Percentages of Closure Codes % - Pie Chart
|
|
| Percentages of Break Durations % |
Displays the distribution of break durations as a percentage of the total breaks. |
Break Durations Report page
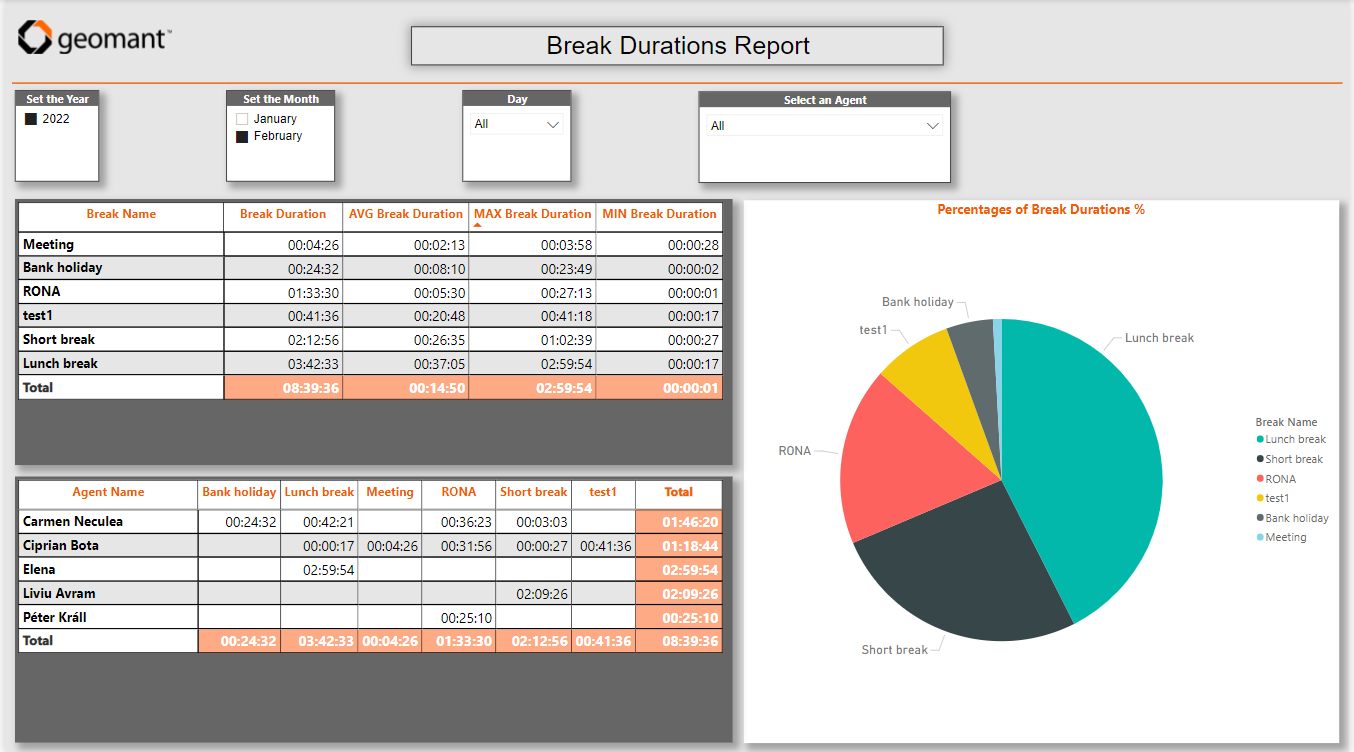
The break durations report page contains information about the durations of different break states the agents used. The break codes can be configured on the Buzzeasy portal. The break durations report page consists of a table and a pie chart.
Table of Break Durations
|
|
| Break Name column |
All the break names used by agents reported. |
| Break Duration |
The duration of the breaks, in time format. |
| AVG Break Duration |
Average duration of the breaks, in time format. |
| MAX Break Duration |
Longest duration of a break, in time format. |
| MIN Break Duration |
The shortest duration of a break, in time format. |
Email Report page
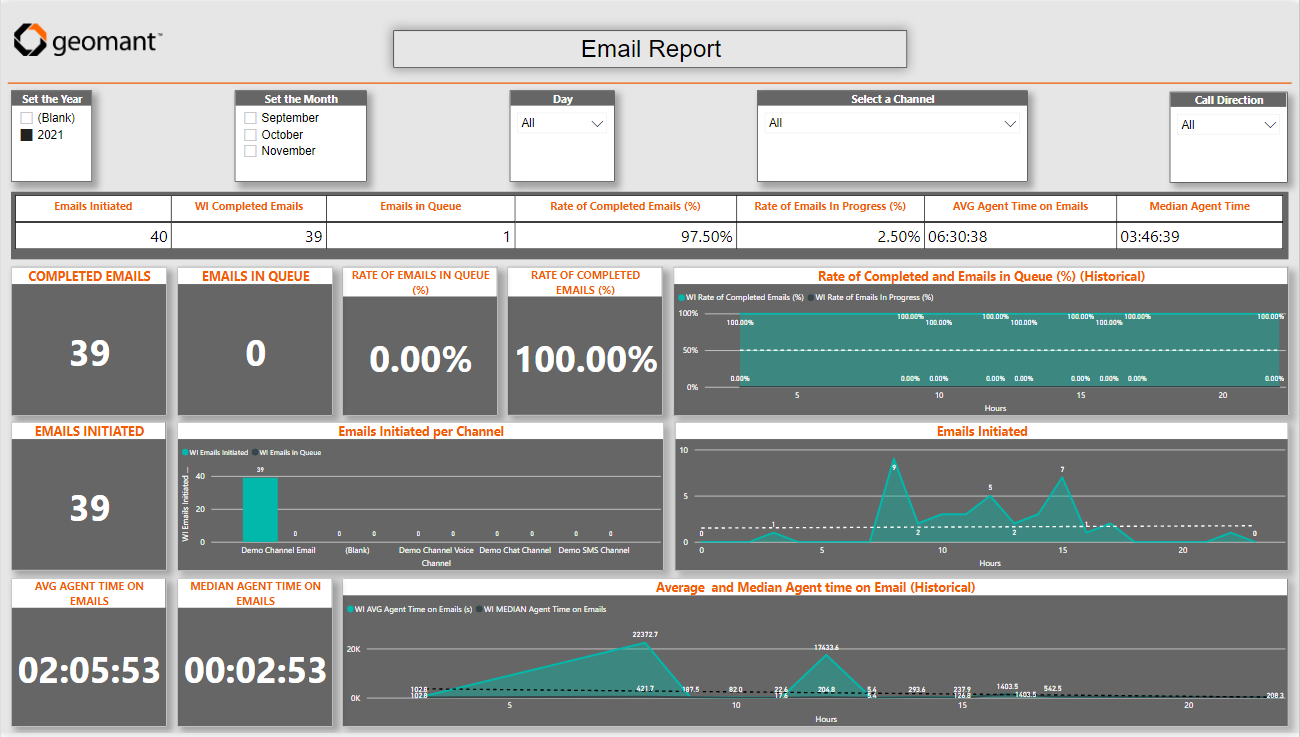
The Email Report page displays information about the email media interactions. Under the filtering menu a single row table displays data for email conversations. Below this visualizations provide a rapid analytical view of the data.
|
|
| Emails Initiated |
Total email interactions. |
| Completed Emails |
Total email records in the Workitems table that has a wrap-up time. |
| Emails in Queue |
Total email records in Conversations table that has an “In Progress” result. |
| Rate of Completed Emails (%) |
Total emails completed as a percentage of total initiated emails. |
| Rate of Emails in Progress (%) |
Total emails in progress as a percentage of total initiated emails. |
| AVG Agent Time on Emails |
Average time agents spent working with the Emails. |
| Median Agent Time on Emails |
Median time agents spent working with the Emails. |
Chat Report page
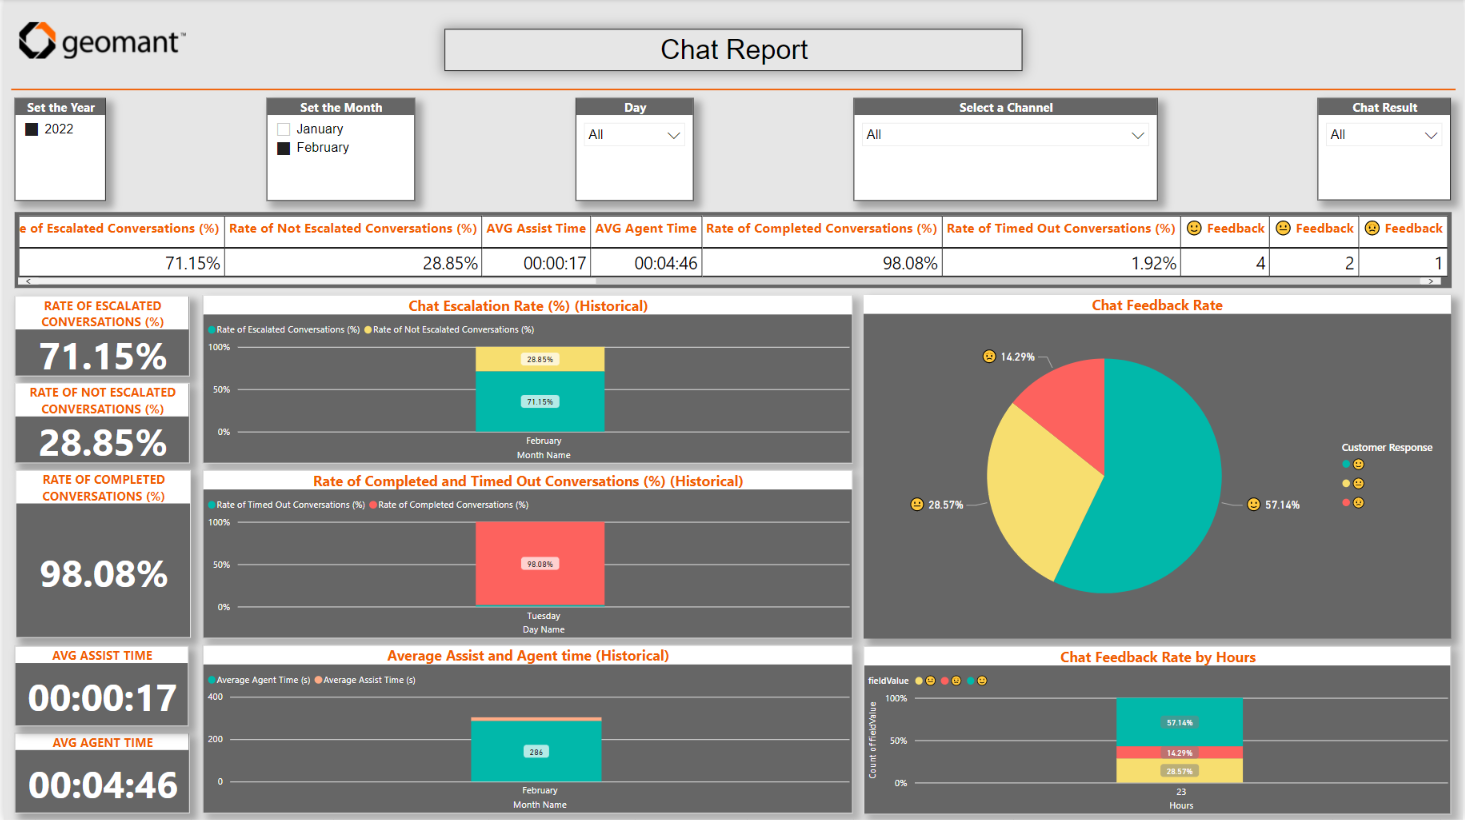
The Chat Report page displays information about chat media interactions. Under the filtering menu a single row table displays data for chat conversations. Below this, visualizations provide a rapid analytical view of the data.
|
|
| Chats Initiated |
Total chat interactions. |
| Completed conversations |
Total completed chat conversations. |
| Timed Out conversations |
Total timed out chat conversations. |
| Escalated Conversations |
Total chat conversations escalated to an agent. |
| Not Escalated Conversations |
Total conversations not escalated to an agent. |
| Rate of Escalated Conversations (%) |
Total chat conversations escalated to an agent as a percentage of the total number of conversations. |
| Rate of Not Escalated Conversations (%) |
Total chat conversations not escalated to an agent as a percentage of the total number of conversations. |
| AVG Assist Time |
Average time customer spent in chat with the chat bot. |
| AVG Agent Time |
Average time customer spent in chat with an agent. |
| Rate of Completed Conversations (%) |
Total completed conversations as a percentage of total conversations. |
| Rate of Timed Out Conversations (%) |
Total timed Out conversations as a percentage of total conversations. |
| 🙂 Feedback |
Total chat feedback - happy |
| 😐 Feedback |
Total chat feedback - neutral |
| 😟 Feedback |
Total chat feedback - unhappy |
Rate of Escalations
|
|
| Rate of Escalated Conversations (%) card |
Total chat conversations escalated to an agent, as a percentage of the total number of conversations. |
| Rate of Not Escalated Conversations (%) |
Total chat conversations not escalated to an agent, as a percentage of the total number of conversations. |
| Chat Escalation Rate (%) (Historical) |
An area chart displaying Escalated and Not Escalated percentages, split by months. Drill down to Days of week, or to Start Hours. |
Rate of Completed Conversations
|
|
| Rate of Completed Conversations (%) card |
The percentages of conversations with Completed result. |
| Rate of Completed and Timed Out Conversations (%) (Historical) |
The percentages of conversations with Completed and Timed Out results, split to months but can be drilled down to Days of week. |
Call Duration Averages
|
|
| AVG Assist Time card |
Average time the customer spent in chat with the chat bot. |
| AVG Agent Time |
Average time the customer spent in chat with an agent. |
| Average Assist and Agent time (Historical) |
An area chart displaying Assist duration and Agent average duration in seconds, split to months. Drill down to Days of week, or to Start Hours. |
Chat Feedback Rate
|
|
| Chat Feedback Rate (%) |
A pie chart displaying the rate of customer response to the feedback prompt. |
| Chat Feedback Rate by Hours |
A 100% stacked column chart displaying the percentages of customer feedback emojis, split by hours. |
Callback Report page
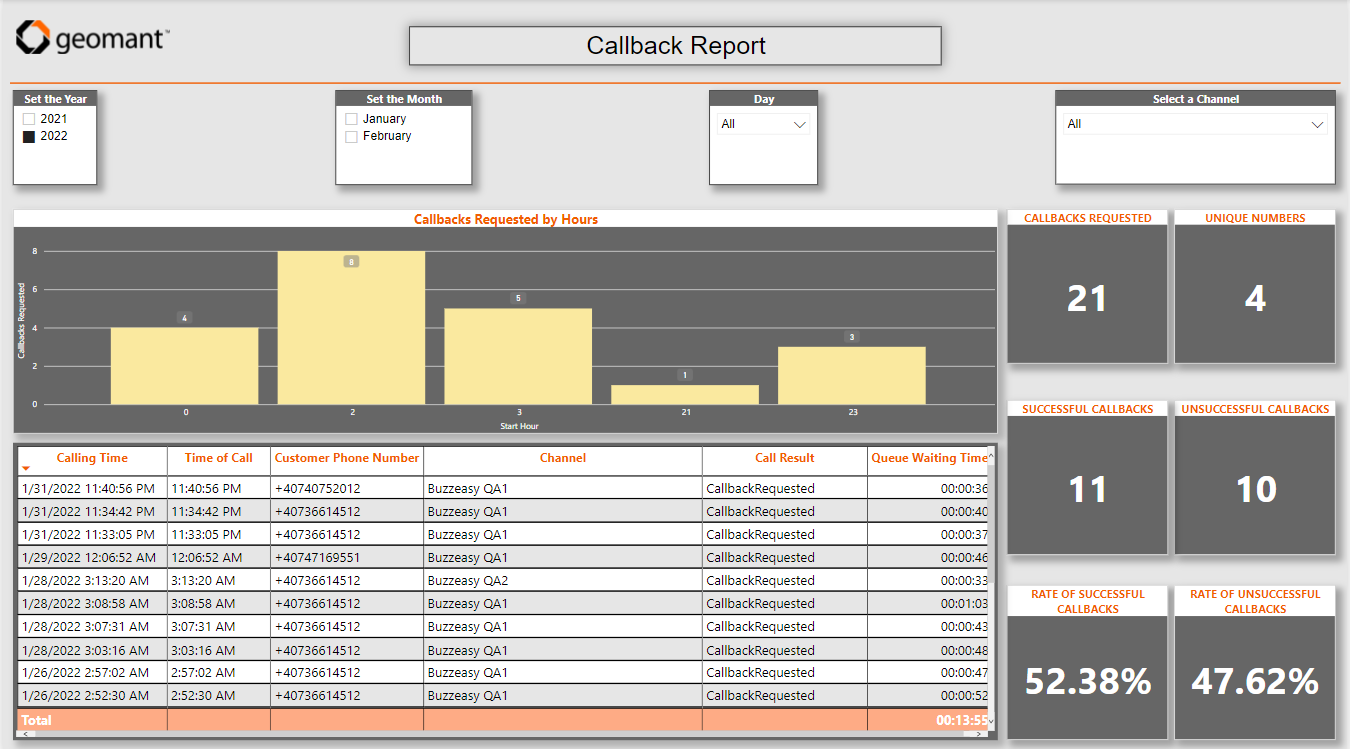
The Callback Report page contains information about the requested callbacks. If it is setup, Buzzeasy will offer a callback for the customer after reaching the pre-defined time period waiting in the Queue. The outcome of a requested callback can be successful and unsuccessful.
Callback Requested by Hours visual
|
|
| Callbacks Requested by Hours |
A clustered column chart visualization. Displays the total callbacks requested in the queue, split by hours. |
Table of Callback Requests
|
|
| Calling Time |
The date-time stamp of the call arrived in Buzzeasy. |
| Time of Call |
The time-stamp of the call. |
| Customer Phone Number |
The caller's phone number. |
| Channel |
The channel used for the call. |
| Call Result |
Call result, filtered by callback requested. |
| Queue Waiting Time |
The duration spent waiting in Queue. |
Card KPIs - Right hand side of report page
|
|
| Callback Requested |
Total Callbacks Requested. |
| Unique Numbers |
Total of unique phone numbers. Multiple sequential callback requests from the same number are counted once. |
| Successful Callbacks |
Total successful customer callback calls. |
| Unsuccessful Callbacks |
Total failed customer callback calls. |
| Rate of Successful Callbacks % |
Total successful callbacks as a percentage of the total callbacks requested. |
| Rate of Unsuccessful Callbacks % |
Total unsuccessful callbacks as a percentage of the total callbacks requested. |
