Monitoring systems installation
Spring Admin
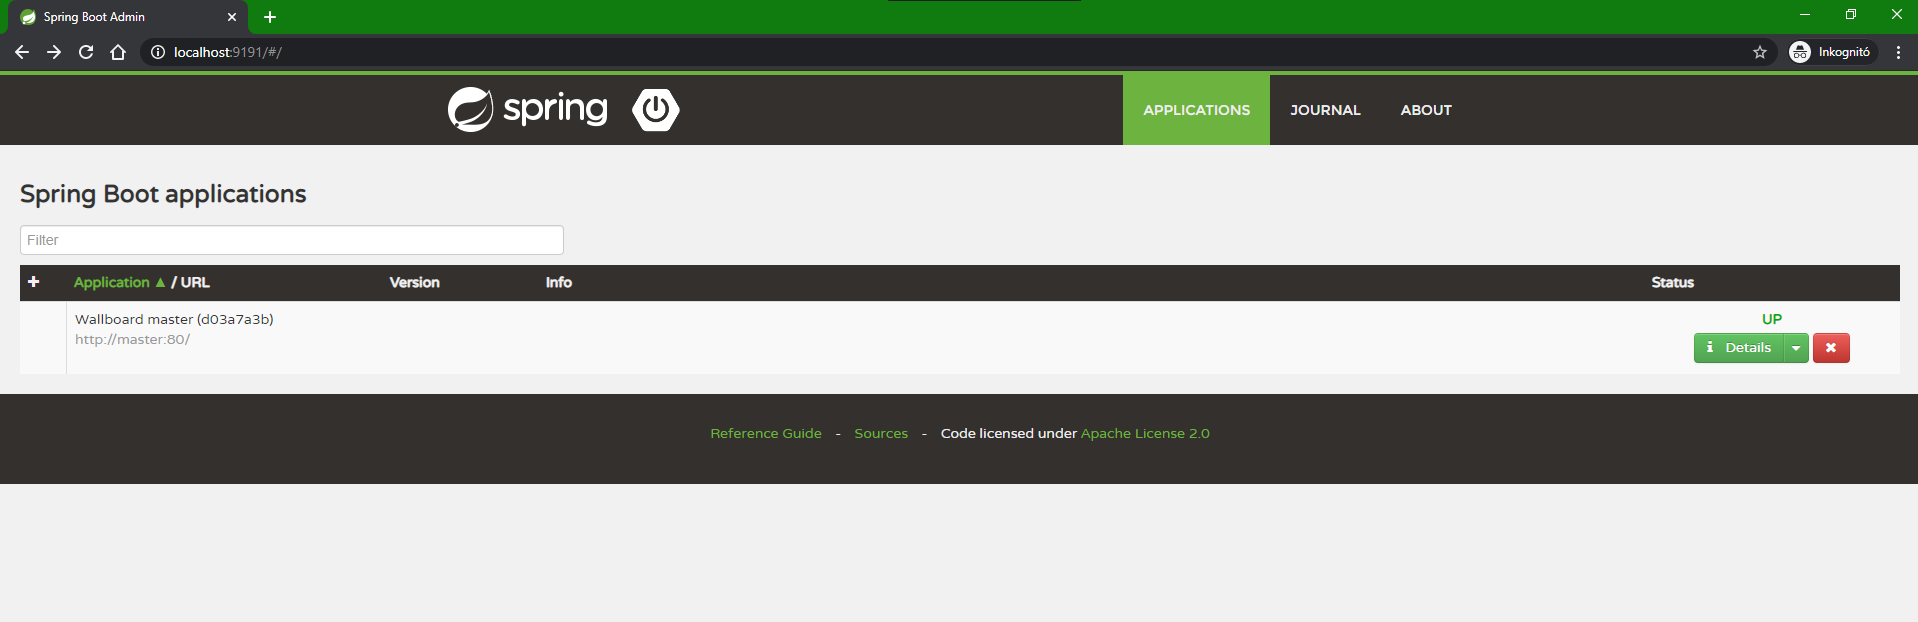
Spring Boot Admin is a web application, used for managing and monitoring Spring Boot applications. Behind the scenes, the magic is given by the Spring Boot Actuator endpoints.
With this compose, you are able to reach the web page only from the server or with port-forwarding to port 9191.
Spring Admin provides the following features:
- Monitoring and Healthcheck
- Request tracing
- Audit log
- Runtime log level settings
Grafana
Grafana is a multi-platform open-source analytics and interactive visualization web application. It provides charts, graphs, and alerts for the web when connected to supported data sources. It is expandable through a plug-in system. End users can create complex monitoring dashboards using interactive query builders.
We are using Prometheus as a data source and MySQL and node exporters to get data. You can find more info about these services in their section below.
More info: https://grafana.com/docs/grafana/latest/getting-started/
With this compose, you are able to reach the web page only from the server or with port-forwarding to port 3000.
Before the compose-up run the following command and configure the variables:
mkdir -p /srv/docker/grafana/data && chown -R 472:472 /srv/docker/grafana/data
Variables:
Grafana environment:
- {GF_SECURITY_ADMIN_PASSWORD}: replace with the password you want to use for the admin user
Mysql exporter (db_exporter) environment:
- {DATABASE_PASSWORD}: replace with the master's database password
You can connect the Prometheus as a data source with the following link: http://prometheus:9090.
We are using four dashboards, you can import them with the following IDs:
- MySql: 7362
- Node exporter: 1860
- Spring: 6756 /4701
Prometheus
Prometheus is a systems and service monitoring system. It collects metrics from configured targets at given intervals, evaluates rule expressions, displays the results, and can trigger alerts if some condition is observed to be true.
More info: https://prometheus.io/
If you changed the IP addresses of the services in the compose file, configure the following prometheus.yml file and bind mount for Prometheus container.
Node-exporter
Prometheus exporter for machine metrics, written in Go with pluggable metric collectors.
More info: https://github.com/prometheus/node_exporter
Mysqld-exporter
Prometheus exporter for MySQL server metrics.
More info: https://www.github.com/prometheus/mysqld_exporter