Pyramid Chart Widget

Note: this section is only visible if you have any kind of datasource already set up, as this widget can't work without connected data.
With the Pyramid widget you can make a chart of your datasource.
You can use the Data binding tool to select your Datasource.

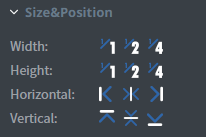
In the Size & Position menu you can select the width, height, and placement of your widget quickly.
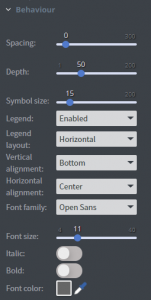
In the Behavior menu you can set the spacing, depth, and size of the symbols.
- You can choose to display or do not display your legend.
- You can set the layout, the vertical, and the horizontal alignment of the legend.
- You can also set the font family, size, style, and color of the legend.
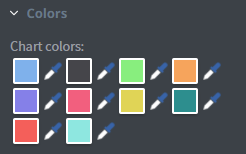
In the Colors menu you can set the color of the columns individually.
In the Effects menu you can select a background image or color to your widget.
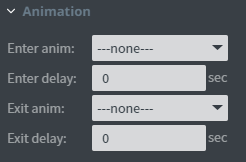
In the Animation menu you can choose the enter and exit animations of your widget.