Gauge Widget
![]()
Note: this section is only visible if you have any kind of datasource already set up, as they can't work without connected data.
With the Gauge widget you can display your Datasources in your content in gauge format.
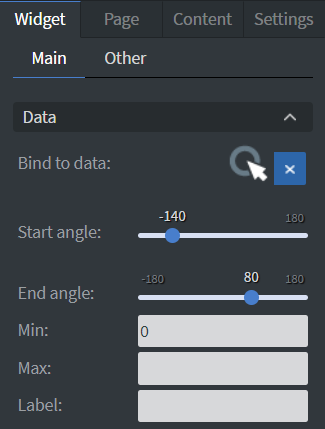
In the Data menu you can use the Bind to data tool to select your Datasource.
- You can set the starting and the ending angle of your gauge.
- You can also set a minimum and a maximum value and add a label to your gauge.
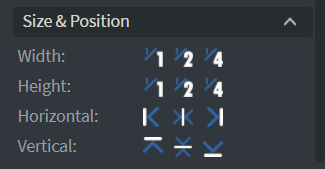
In the Size & Position menu you can select the width, height, and placement of your widget quickly.
In the Behavior menu you can set a spacing to your gauge as well as disable its animation.

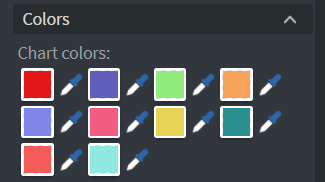
In the Colors menu you can select the colors of your widget individually.
In the Effects menu you can select a background image or color to your widget.
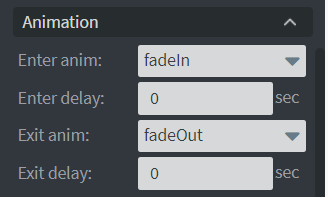
In the Animation menu you can choose the enter and the exit animation of your widget.