Column Chart Widget
![]()
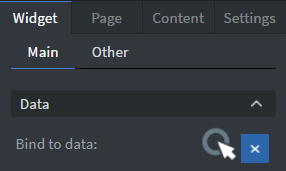
Note: this section is only visible if you have any kind of datasource already set up, as they can't work without connected data.
You can use the Data binding tool to select your Datasource.
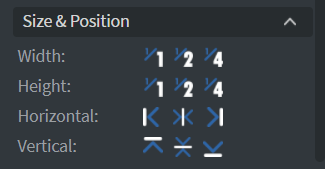
In the Size & Position menu you can select the width, height, and placement of your widget quickly.
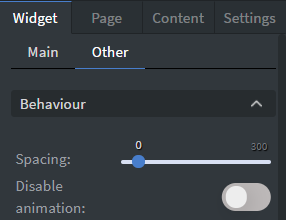
In the Behavior menu you can set the spacing and the depth of your chart.
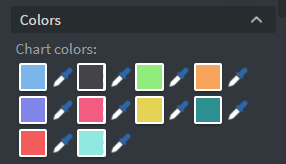
In the Colors menu you can set the color of the columns individually.
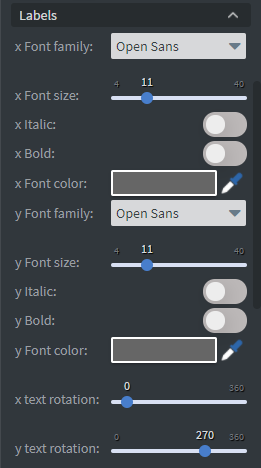
In the Labels menu you can select the font family, size, and style of your bar labels on both axis. You can also set the text rotation to both axis.
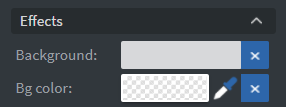
In the Effects menu you can select a background image or color for your widget.
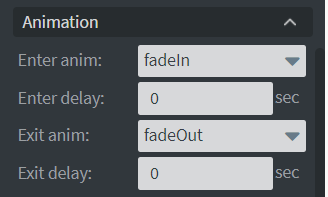
In the Animation menu you can choose the enter and the exit animations for your widget.