Contact Expert v7.6
Understanding Reports in Contact Expert Portal
CE portal provides a range of reports built in covering real-time and interval analytical needs.
While some of these can be used as historical reports, the CE portal is not meant to provide full Business Intelligence services such as data cubes, drill through and other techniques. All these are provided from packages developed for Microsoft BI services.
The CE portal reports can be accessed via the sideways Menu bar.
Reporting Layout
Reports loaded on the CE portal bear the same look and feel. The name of the particular report and the report group it belongs to is displayed in the upper-left corner. The navigation bar is placed next to the title of the report.
Most reports can be tweaked to some extent, but will always show up with some default settings and presenting lists of details.
Navigating in the Reports
Navigating between portlets (individual sections of a report) on a single page is simpler with the navigation bar next to the report title. The items in the nav bar list correspond to all the open portlets. Clicking them will bring the relevant portlet into view.

Arrows show up on both sides of the full report page when it does not fit the browser window (or available screen size). Click the arrows or use the keyboard arrow buttons to scroll right or left on the report page.
Toolbar
The toolbar is available from the upper-right corner of the page.
The different portlets are easily accessible by clicking the proper information and control icons. The toolbar includes the latest refresh time, the Magic Wand, filters, additional info, etc., refresh interval in seconds and a general Help icon.

Portlets
Portlets are components of the portal providing access to specific information and aggregating different contents. For example, the Details, Summary or Filters sections of the page are referred to as portlets.
Each portlet can be collapsed or expanded by using the collapsible control icons. If you close a portlet, it will disappear from the report view and from the nav bar. However, it can easily be reinstated by using the toolbar in the upper-right corner.
Filtering Report Data
Filters help hide irrelevant data to be able to focus on trends that matter. Different types of filters amend the reports and make the query results more efficient.
When having access to more than one tenant, users can also filter to tenants on top of the report specific details.
Tip
Filtering a parameter with no data (e.g. a Business Unit with no Agents, or a Tenant with no report data in the defined time period) will present no records.
Filter Types
Drop-down Lists
There are single-select and multiple-select lists:
- Single-select drop-down lists: only one option can be chosen from the list.
- Multiple-select drop-down lists: more options can be selected from the list. Selection can be done one-by-one and the selected ones will be marked with a tick. If you select one or two options from the list, the designation of the choices selected will be listed in the search field separated with a comma. In case of 3 or more options, the number of selection will be presented in the search field.
On top of report data, these lists typically contain special entries as well:
- All: Selects all available options from the list.
- None: Deselects all options from the list.
Time Range Selectors
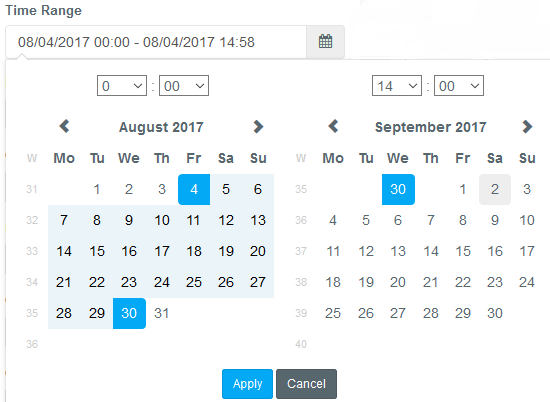
These determine the date and time range of the report search criteria, wherever applicable. The selector shows two calendars: the range start (left) and range end (right) calendars.
- Click on the Time Range field to be presented with the selector.
- Set the range start date by click on the desired start day in the left side calendar.
- Set the range end date by clicking an end day shown in either the left or the right calendar. The range end date must be later than the range start date. The desired range will be highlighted in the calendar(s).
- Set the exact time from the drop-down list for a more specific search. You cannot specify a time period unless a date is already selected.

If needed, scroll through the months and years using the scrolling arrows in either calendars.
Note
The Range End date must be set to a date later than the Range Start date.
Date selectors
These are similar to Time Range selectors, but are much simplified. You simply specify a calendar day to limit the search.
Free-text fields
You can enter a search criteria by manual input. This can be useful in case you are looking for an e-mail task of which a piece of information is available only.
Time duration selector
These define an exact time period.
Check-boxes
Checkboxes perform a "yes/no" type filtering specified to individual reports. These could include filters such as Group by to alter the aggregation detail of certain reports, for example to group on a team level or on individual agent level.
See the tooltips of the individual checkboxes for further details.
View Settings
Portal users can modify certain settings of a particular report with the Magic Wand option. This icon displays the View Settings portlet next to the Filters on the page.
Set the preferred columns for the table view or manually adjust a couple of the thresholds.
Optimizing the report interface has an immediate effect on the Details table view, but it does not save the changes. If you navigate away from the page, the changes will be lost.
Saving View Settings Changes
After making adjustments, you have the option to save the current view as a new preset.
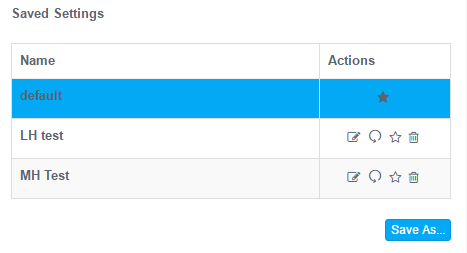
- Use the Save As... button in order to create a new template.
- Assign a unique name to the preset and click the Save (disc) icon.
| Save | Saves changes into the active preset. |
| Save As... | Creates new presets with the custom settings. |
| Cancel | Cancels the saving process. |
| Activate | Applies the chosen preset. The one in the light blue background is the preset currently in use. After navigating away the page, the default preset comes into operation. |
| Default | Set a preset as the default one, which preset will be the preferred one and will be applied immediately when navigating to the report. |
| Rename | Add a new recognizable name to the preset. |
| Delete | Removes a preset, if irrelevant. |
Setting a preset as default does not activate it. Activating a preset does not make it default.

Exporting Report Data
Some tracking reports can be copied into the clipboard or exported to a spreadsheet document making it easier to examine reports returning plenty of data.
- Call History
- Email History
- Chat History
- Agent Status History
- Agent Login History
Exporting Action Buttons
The actions buttons can be found on the Details portlet. You can either copy the table, or save (export) to .csv or .xlsx files.

Note
If you use Internet Explorer v11 and are unable to download exported data, please check your internet options for the relevant security zone's custom level settings ActiveX controls and plug-ins > Automatic prompting for ActiveX controls and Downloads > File downloads and Font downloads. All of these should be enabled. If you had to change any of these, you might need to restart IE or event the computer to make these active. You will also need to make sure you have a default app associated to CSV and XLS file types.
Refreshing Reports
Report data can get refreshed automatically, using a built-in timer, or manually.
Built-in refresh
Some reports have predefined intervals for auto-refresh. This time period is needed to collect, aggregate, cache and display the data. The refresh interval rate can be checked by hovering over the clock icon in the filters section.
Manual refresh
To update report data, click the Apply button in the Filter portlet.
Summary Section (Where Applicable)
It provides an aggregated view of the specific report by summing up the information that is detailed in a table view on the same page.
The coloring of the different reports' Summary sections is not universal. The Operational Reports → Agent Performance → Tasks coloring refers to the importance of data it represents. The colors used in the Real-Time Monitors → Agent Status Monitor report refers to the agent activity.
Additional Details
These present details that not visible on the report page, but provide further information on a specific entry.
These can be accessed by clicking on the information icon in the toolbar.
Details Portlet
This is typically the the main part of the reports. The Details portlet is typically rendered as a table of data, meaning rows of columns.
The sort order of the Details portlet, or in fact any table view in any portlet, can be changed by clicking on a preferred column header. The table can be optimized by the Magic Wand function where applicable to set the preferred columns or adjust a few of the thresholds.
The list can be in either ascending or descending order. A small grey sort icon placed next to the header will show the current order.
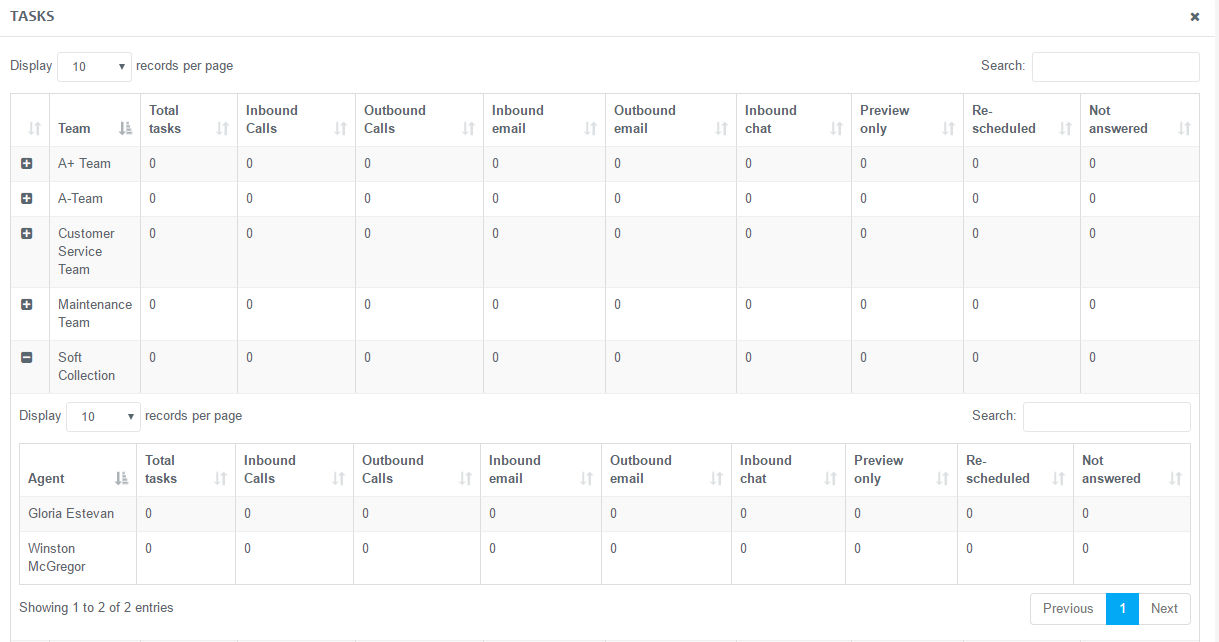
Nested Tables
Nested tables support columns that contain entire sub-tables. You can drill down or up by clicking on the collapsible control buttons. Drilling-down shows more data, while drilling-up shows less data in the table.

Chart Views
Charts illustrate results in an intuitive, clear and concise manner and simplify data in a presentable way.
The available chart views are pie charts, combo charts and line charts.
Tooltips
Tooltips explain what the tool icons and texts represent and help in understanding what the parameters or filtering options are used for.
Move the cursor over any element, like icons, table headers, texts or the row of a search criteria and a text-box will appear explaining the precise usage of the given object.
Thresholds
Thresholds control certain aspects (visual alerts and data representation) of the reports set on a tenant level. These serve as benchmarks for guidance and any breach can be a call for a review of the situation. Thresholds can be used for evaluating performance or measuring a level of quality or quantity.
The Supervisor and the Administrator roles have the ability to define these values.
Read the Report thresholds article for further details on the individual threshold parameters.
Threshold Naming Convention
Each threshold record is named consistently starting with name of the concerned report, then the designation of the value followed by the unit of measure. The values can be defined in seconds, percentage or numbers.
Visual Alert Thresholds
When a value reaches or exceeds the predefined threshold limit, the background of the indicator turns red on the reporting page.
Data Thresholds
These values do not have any visual signs on the report.
These thresholds affect the data to be presented in a particular report in the form of a number. in case the threshold value is reached or exceeded for a related item, the report will be calculated. It adds up the number of all these items and presents it on the particular report.
This kind of threshold is available for the Scheduled Tasks Status Monitor.
Data Threshold Example
You wish to be notified about Scheduled not handled for more than 30 minutes.
- Navigate to Reports → Thresholds menu.
- Click Edit of the preferred Tenant and specify the Scheduled Task Status Monitor - Maximum Scheduled Task Delivery Time threshold value to 1800.
- The amount of scheduled tasks passed the set value will be visible on the Reports → Real-Time Monitors → Scheduled Tasks Status Monitor report.
Time Based Reporting Thresholds
It is used to measure the time spent on a task or in a specific status. The referred value has to be specified in seconds.
Time Based Reporting Threshold Example
Let's assume an agent cannot be in Wrapup status for more than 2 minutes.
- Navigate to Reports → Thresholds menu.
- Click Edit of the preferred Tenant and specify the Agent Status Monitor - Maximum Duration of a Task in 'Wrapup' Status [sec] value to 120.
- When an agent is being in Wrapup status for more than 2 minutes, then a visual alert appears on the Reports → Real-Time Monitors → Agent Status report's Details section. The Status Time will be shown in red.
Percentage Based Reporting Thresholds
It is used to measure quantity in relation to a whole, e.g.: the rate of abandoned calls or the level of agent answer. The referred value has to be set in percentage.
Percentage Based Reporting Threshold Example
The rate of abandoned calls in the queues need to be measured. The system should show an alert when the number of dropped calls reaches 10%.
- Navigate to Reports → Thresholds menu and click Edit of the preferred Tenant.
- Specify the Maximum Ratio of Abandoned Requests in Voice Queues (%) value to 10.
- Go to the Reports → Operational Reports → Queue Service Level page and filter for all the voice queues, then click Apply button.
- If the number of dropped calls reaches 10%, the Abandoned value will be shown in red for the affected voice queue.
Number Based Reporting Thresholds
It is used to measure quantity, e.g.: requests queued in a campaign. The referred value has to be specified in numbers.
Number Based Reporting Threshold Example
You wish to be notified about more than 10 requests waiting in a queue.
- Navigate to Reports → Thresholds menu and click Edit of the preferred Tenant.
- Specify the Maximum Number of Requests Waiting in Email Queues value to 10.
- Go to Reports → Real-Time Monitors → Queue Status page and filter for the preferred queue(s) in the preferred tenant.
- If a queue has more than 10 requests waiting to be handled, the number will be shown in red in the Waiting Interactions column.