General components of a Power Pivot data model
Contact Expert v6.1 for Skype for Business Server
Power Pivot realizes part of the server based SQL Server Analysis Services as a flexible, in-memory "tabular" database engine that is capable of effectively handling tens of millions of data records on desktop computers and laptops. It works together with Excel to provide a unique analytical database - reporting tool pair.
One can create a complex data model in Power Pivot with the following main components:
- Data tables with potentially millions of data records imported from external data sources of various kinds
- Relationships among the tables
- Calculated columns extending the imported tables
- Measures (a.k.a. calculated fields) summarizing data using simple or complex logic based on several records and tables.
- Key performance indicators (KPIs) to visually present performance values calculated by measures
These table columns, measures and KPIs are used in Excel to build complex pivot tables, pivot charts and free form reports.
Data tables
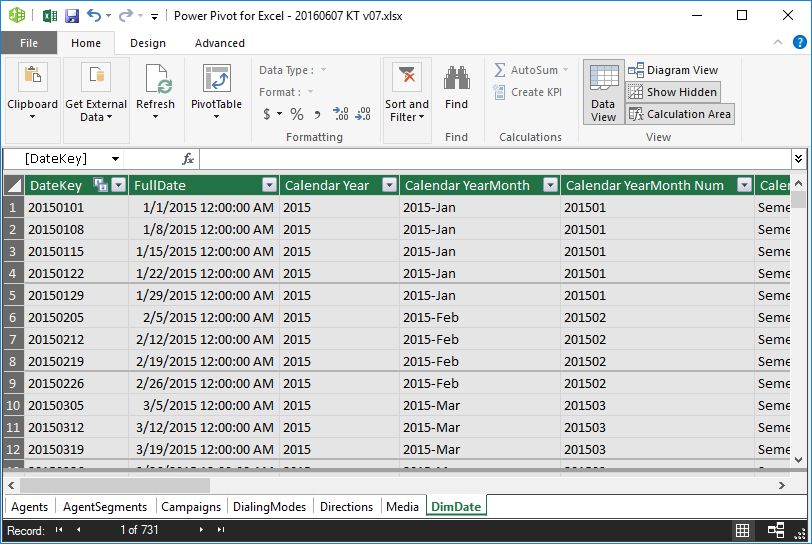
Data is stored in Power Pivot in the form of data tables. Each table is shown on a separate tab within the Power Pivot application. These data are replicas of some external data source like tables from relational databases, from other Excel files, from ASCII files and from many other possible data sources including data provided online on the Internet.
The data is presented in rows (records) and each row consists of one or multiple columns (fields). The data tables - more specifically the records - can be extended adding calculated columns and the individual data tables can be linked together using relationships.
 {.image-right width="290"}
Relationships
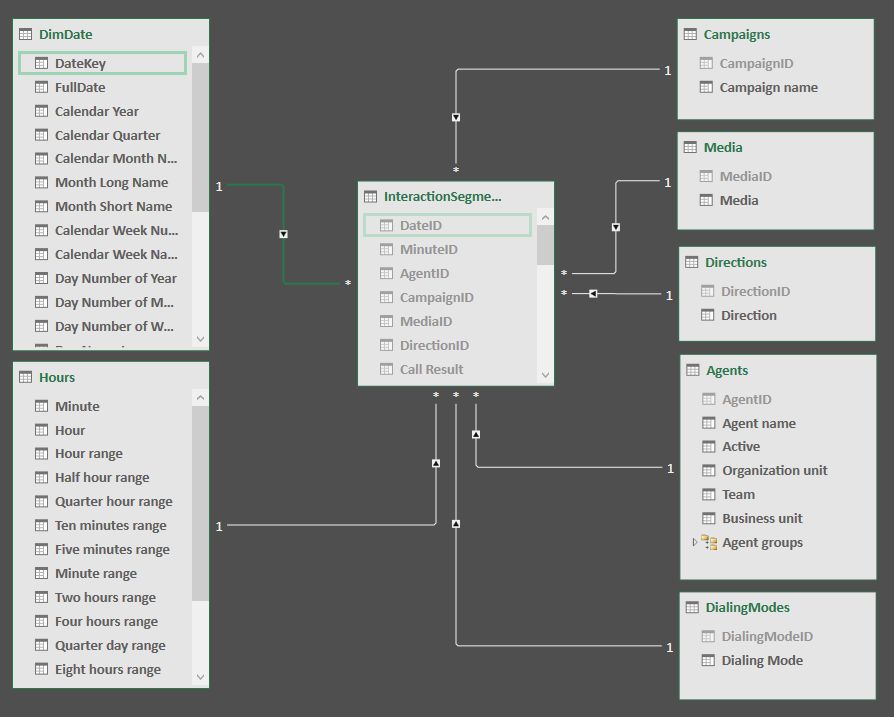
In MS Excel one might create links between tables using the VLOOKUP function. However this solution has some limitations and becomes practically unmanageable when dealing with many tables and many records in the tables. Power Pivot provides a solution for this problem. One might set up relationships between tables as it is done in relational database management systems. Relationships are limited to one-to-many types. Many-to-many relationships could be managed using some more advanced tricks.
In BI reporting the source data is generally partially de-normalized, thus less lookup tables and relations are required. However it does not mean that one will/should not use relationships at all. Setting up such relationships between the data tables can be done using the Diagram View of Power Pivot.
Further readings:
- Relationships Overview (MSDN)
 {.image-right width="290"}
Calculated Columns
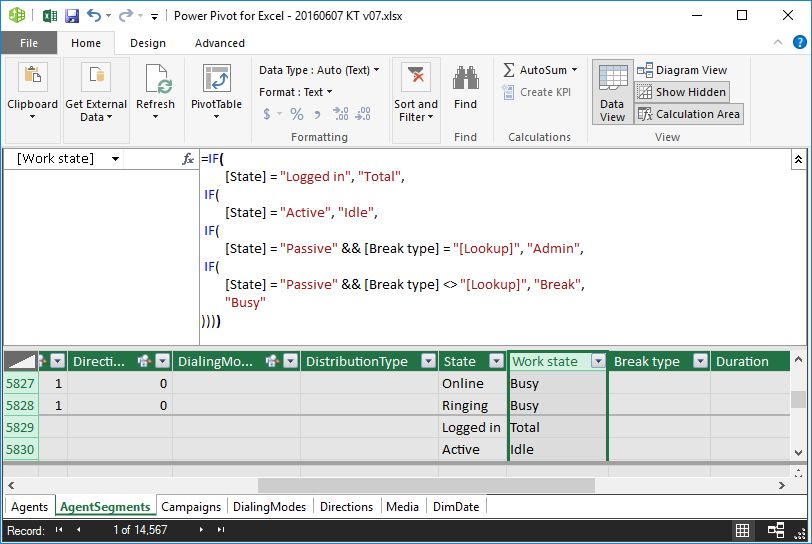
With calculated columns, you can add new data to a table in your Power Pivot Data Model using Data Analysis Expressions (DAX) formula. This is similar to adding a calculated column in an ordinary Excel table. There are several differences though. Column cells are not treated individually, i.e. it is not possible to enter different expressions into the cells of the column. You define the calculation expression for the entire column.
Further readings:
 {.image-right width="290"}
Calculated fields (measures)
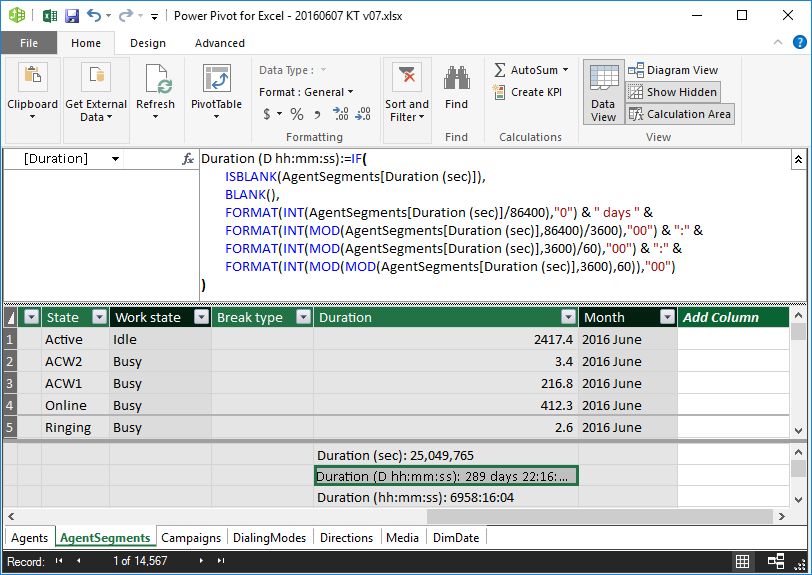
Calculated fields, also known as measures in earlier versions of Power Pivot, are calculations used in data analysis. Unlike calculated columns, calculated fields perform calculations on many records (rows) in the database. Examples commonly found in business reports include sums, averages, minimum or maximum values, counts, or more advanced calculations that you create using a Data Analysis Expressions (DAX) formula.
Further readings:
 {.image-right width="290"}
Key Performance Indicators (KPIs)
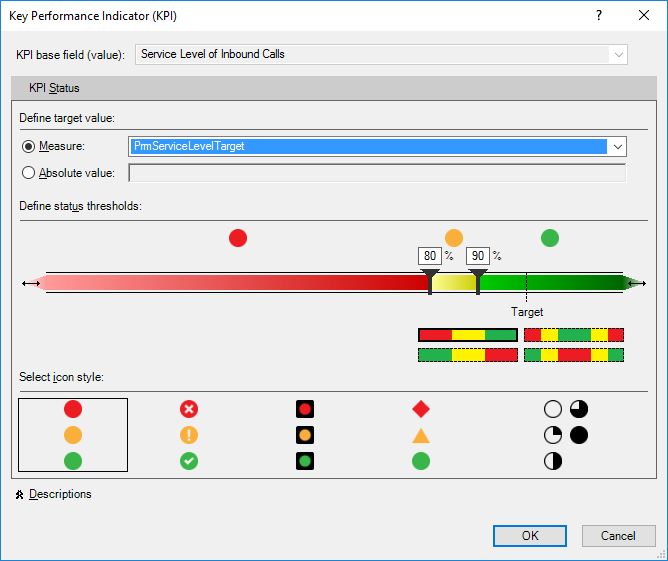
Key performance indicators (KPIs) are visual measures of performance. Based on a specific calculated field, a KPI is designed to help users quickly evaluate the current value and status of a metric against a defined target. The KPI gauges the performance of the value, defined by a Base calculated field, against a Target value, also defined by a calculated field or by an absolute value. Of course this means that before using a KPI, you should have a calculated field created for which you implement the KPI visualization.
Further readings:
 {.image-right width="290"}